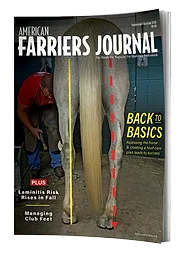
A number of recent Facebook comments about the American Farriers Journal (AFJ) yearly Farrier Business Practices Benchmark survey provides me with the opportunity to explain the details and methodology behind the only in-depth analysis of the farrier industry. Anvil Brand, Glue-U, Hoof MD and Vetericyn sponsor the survey.
- This survey began with the previous owners in 1989 before we purchased AFJ in 1992. Since then, we’ve expanded the survey of farrier business practices. For a number of years, the survey was conducted every second year, but we shifted to conducting the survey each year in 2025.
- This is the only intensive survey of farrier business practices conducted yearly for the U.S. farrier industry. It is our chance to share the thinking and insights of farriers across the country along with highlighting important changes taking place in the hoof-care world.
- The extensive survey data collected over the years lets our AFJ staffers do an in-depth analysis and spot changes and trends. As an example, average “trim only” charges have increased from $19.94 in 1996 to $57.80 in 2026.
- This is not a scientifically based survey. We simply collect data from farriers who choose to take the survey. Farriers who fill out the survey change from year-to-year.
- The survey is not sent to horse owners, suppliers, equine veterinarians, educators or others involved in the equine industry. It only goes to farriers.
- The data reported in the 2026 July/August AFJ issue and on the AFJ website was only for full-time farriers. Data from part-time farriers was not included.
- For many years, we mailed the survey to all farriers for which we had a mailing address. It was not sent only to AFJ subscribers.
- Since 2002, a paid subscription to AFJ has not been a part of an American Farrier’s Association membership.
- Beginning in 2012, the survey has been sent via email annually to every farrier for which we have an email address. Printed copies are also made available to annual International Hoof-Care Summit attendees and were also mailed to 388 Amish farriers for which we had addresses.
- This year’s survey was emailed to 8,991 farriers. Second and third survey reminders were sent over the next 2 weeks.
- The survey was emailed on February 22 with a final deadline of March 15.
- The 2026 email survey received 604 responses to this year’s 84-question survey. This was a nearly 7% favorable response, while many email surveys conducted today in other industries only receive a 2-3% response.
- We’re asking a lot among farriers taking the 84-question survey, as it normally takes 45-50 minutes to complete. If farriers only answer a few survey questions, their survey results are discarded.
- Farriers rely on the extensive pricing data that is an important part of the survey as a reference for setting the following year’s pricing structures. Many rely on the detailed national and regional pricing data to justify price increases.
- For instance, full-time farriers work an average of 39 hours per week. Allowing 3 weeks for vacation and other activities, these farriers work 1,911 hours per year. Half of their work is “trims only” while the other half is “trims and shoes.” Only 3% do “trims only.”
- With $135,736 in annual gross income before expenses, their farrier work grosses an average of $71.03 per hour.
- By comparison, part-time farriers work an average of 17 hours per week. Allowing 3 weeks for vacation and other activities, these farriers work 833 hours per year. 53% of their work is “trims only. Only 3% of these part-time farriers are likely barefoot trimmers who do “trim only” work.
- With $41,696 in annual gross income before expenses, their farrier work grosses $50.06 per hour.
- There are also interesting differences in product use between full-time and part-time farriers. A good example is overall shoe usage during the year as shown here:
Yearly Breakdown of Shoe Usage by Farriers
Shoe Usage Full-Time Farriers Part-Time Farriers
Steel keg shoes 77% 76%
Aluminum keg shoes 8% 6%
Synthetic/other nail-on shoes 2% 2%
Handmade shoes 7% 6%
Direct & indirect glue-on shoes 6% 10%
— Data from 2026 American Farriers Journal Farrier Business Practices surveyDownload the Free Report
Get your free copy of the 2026 American Farriers Journal Farrier Business Practices survey,sponsored by Anvil Brand, Glue-U, Hoof MD and Vetericyn, by visiting AmericanFarriers.com