Conducted annually by American Farriers Journal, the Farrier Business Practices Survey Report establishes a baseline for the state of the hoof-care industry. The survey — made possible by Anvil Brand, Glue-U, Hoof MD and Vetericyn — is sent to farriers across the United States, and the resulting data is presented here to help you evaluate your business and prepare for the future.
To keep your operation thriving and competitive, it’s important to step back and look at how fellow farriers are conducting their businesses. Analyzing how charges for services and income have evolved, how business practices may be shifting, how client and horse demographics may affect your bottom line and other industry trends are vital for setting your business up for success.
Sponsored by:
The yearly Business Practices Survey Report is designed to provide you with the most impactful and timely information on the hoof-care industry. From questions about location and demographics to pricing, therapeutic shoeing and continuing education, this comprehensive survey paints a compelling picture of the current U.S. hoof-care industry.
Clients Increase, Horses Decrease
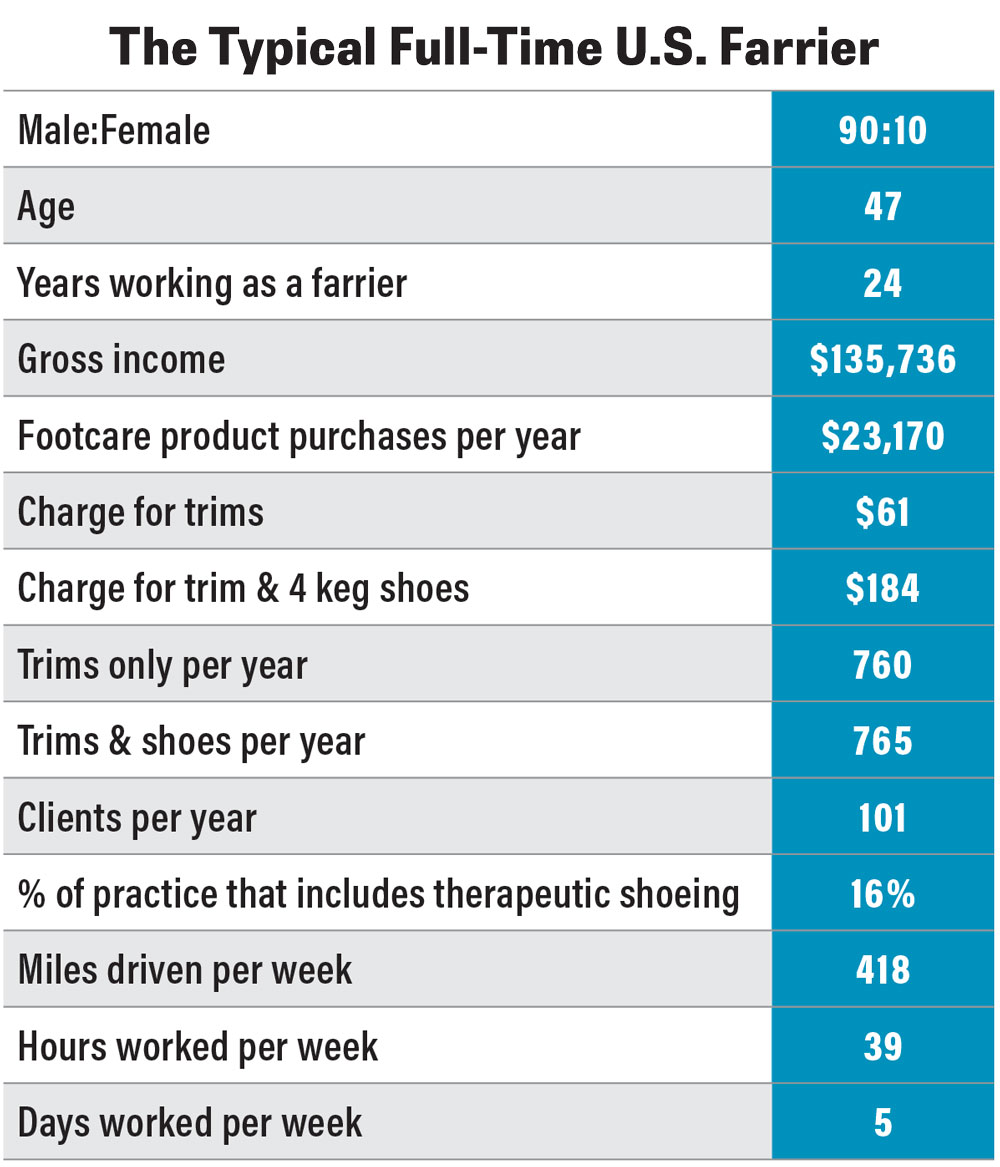
Throughout the year, farriers report working with 101 clients and 300 horses. Year over year, that’s roughly 12 more clients and 71 fewer horses. This comes to around two horses per client — a drop from just over four horses per client last year.
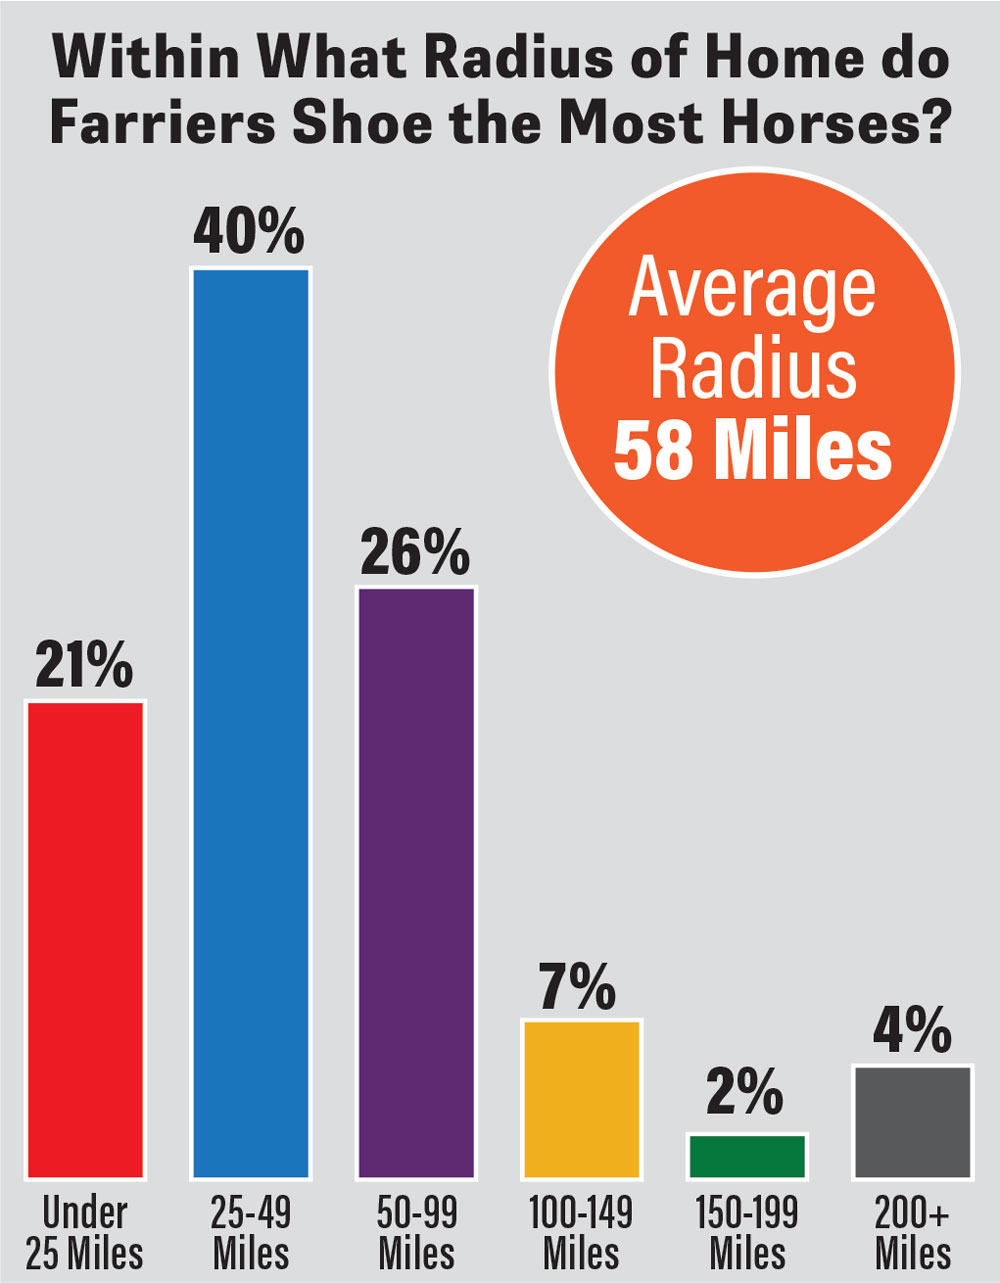
Farriers in the West lost 24 clients on average and 68 horses between last year’s survey and now. All other regions gained between two and 12 clients, and the Southwest gained 41 on average. The number of horses lost from regional books varies greatly, but the downward trend is clear. At the same time, farriers are driving more miles per week, up 38 miles, within a 58-mile radius of home. With rising costs of equine care and maintenance, horse owners might be downsizing, and farriers are adding clients to keep up.
Use These Insights to Boost Your Business
American Farriers Journal’s annual Business Practices Survey contains a multitude of charts, data and trends to peruse. They may not match your business closely or at all. While the results of any survey should be taken with your own needs and surroundings in mind, it provides a window into how farriers around the country are operating their businesses.
Here are a few ways to use these results:
Assess Your Business. Compare your income and charges to farriers around the country and within your region. Many farriers are reluctant to raise prices for fear of losing clients or simply because they sell themselves short. Seeing the national and regional averages can help quell those fears.
Educate Clients. If a horse owner thinks you’re charging too much for your services, and you’re closer to the national or regional average, show them these survey results. Trends such as mileage driven, time and money spent on continuing education and types of horses shod can help clients understand your business practices.
Set Goals. Accurately identifying your gross income, money spent on supplies and other key metrics of your business can help you assess its health in the short- and long-term. Comparing yourself to the national average can also help you set financial, business and personal goals for the future.
While at the barn, the majority of farriers do not supplement their income by selling products to horse owners. Compared with the previous survey, slightly fewer farriers recommend products to owners as well, sitting at 74% of respondents vs. 2025’s 79%. The most common products recommended and sold to clients are dietary supplements and thrush treatments. Three-quarters of respondents reported seeing thrush weekly or monthly.
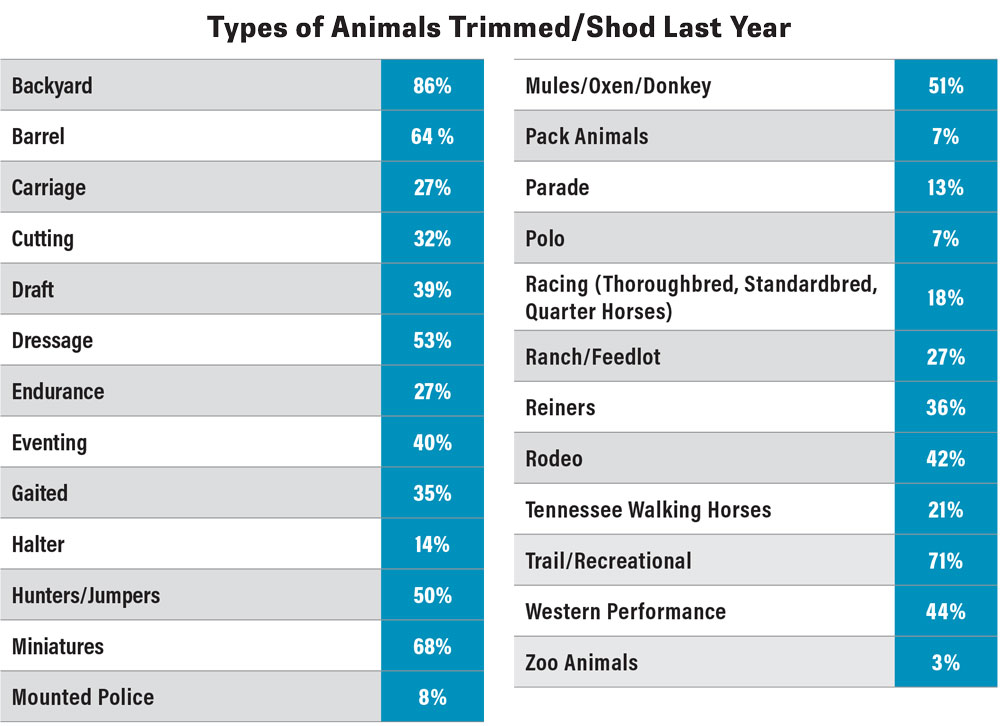
As preferences, demographics and economic situations change, the breeds and disciplines that farriers shoe shift as well. Backyard horses are still the most commonly trimmed and shod. However, the number of farriers who keep backyard horses on their books has shrunk from 91% in 2024 to 86% in 2026. Seventy-one percent of farriers shoe trail and recreational horses, 68% miniatures, 64% barrel racers, 53% dressage horses, 51% mules, oxen and donkey and 50% hunter/jumpers.
Listed in descending order, the remaining breeds and disciplines are trimmed and shod by less than 50% of respondents, including, Western performance, rodeo, eventing, draft horses, reiners, gaited, cutting, ranch/feedlot, carriage, endurance, Tennessee Walking Horses, racing — which includes Thoroughbred, Standardbred and Quarter Horses — halter, parade horses, mounted police horses, pack animals, polo horses and zoo animals.
Across the last three surveys, the number of farriers who shoe certain breeds and disciplines has been trending down. They include backyard, draft horses, eventing, gaited, hunters/jumpers, mules, oxen and donkey, pack animals, parade animals, polo horses, ranch/feedlot horses, Tennessee Walking Horses, trail/recreational horses, Western performance and zoo animals — all dropping 5-12% in the last 2 years.
For reference, 74% of farriers shod Western performance horses 30 years ago, compared with 44% today. Additionally, nearly half of farriers shod endurance horses, while 27% do today. Only 18% of farriers shoe racing horses today, but 30 years ago, Thoroughbreds were shod by 68% of farriers and Standardbreds by 20%.
From a regional perspective, the most common horse that farriers shoe varies. Backyard horses top the list in every region, while second place is split between trail/recreational, miniatures, rodeo and barrel racers. It’s only in the Central and Southeast regions that the national average of trail/recreational horses remains second. In the West, it’s rodeo and the Southwest barrel racers. The third most common breed or discipline to appear on a farrier’s books are split between barrel, trail/recreational, ranch/feedlot, rodeo and dressage across the country.
Previously, backyard horses were not always at the top of the list regionally. In 2025, this was the case in the West and Far West, but in the Northeast and Southeast, racing horses held the number one spot, while in the Central region, it was carriage horses and in the Southwest trail/recreational. Several disciplines and breeds switch positions on the leaderboard year over year, likely due to the changing demographics of respondents. However, backyard and trail/recreational horses usually remain near the top, and equine industry trends can shape what horses a farrier shoes.
Business Management Critical to Success
Managing a business is not always an easy task. It requires organizational skills, discipline, money management and good communication with clients. Understanding current farrier business trends can help you set yourself apart from your colleagues.
Income Increases in Multi-Farrier Practices
In a slight downturn from the previous survey, 17% of full-time farrier respondents report owning or being involved in a multi-farrier practice in 2025. Historically, this number has been closer to 10-15%. However, those in a multi-farrier practice made $167,619 per year, $31,883 more than the national average of $135,736.
A multi-farrier practice in 2025 likely consisted of two farriers who were classified as independent contractors (67%) rather than employees (33%). Around 28% are paid a salary, 31% are paid per horse, 13% are paid a combination and 28% are paid hourly or a percentage of the day.
Even without being involved in a multi-farrier practice, most farriers do not work without another person present in the barn. Some 65% of farriers shoe alone less than 50% of the time or never. Though 79% of farriers do not work with someone to assist them, whether for safety, accountability or company, a barn manager, groom or owner might be present when the farrier is working.
Communication & Business Maintenance
In a literal sense, reaching clients means a truck or a trailer for 86% of respondents, with the remaining operating a haul-in practice or out of a van or SUV. However, in the age of social media and instant communication, operating a business is often about more than just showing up and shoeing.
Up to 70% of farriers are communicating with clients via text message daily, down about 5% from 2025, with a slight shift (up 3%) toward weekly communication. Fifty-one percent receive phone calls daily — an increase of 10% over 2025 — with fewer occurring weekly, monthly or occasionally. Respondents typically communicate via email or their own websites, either occasionally or never.
However, social media is a mixed bag. Some 23% of farriers communicate with clients only occasionally over social media, while 12% communicate weekly. Overall, social media has the most even split between those who speak with clients online (44%) and those who do not (56%).
When it comes to business promotion, the tide is slowly shifting toward social media. Up 11% from 2024, 36% of respondents now use social media to promote their business. The effectiveness of various platforms is disputed, with Facebook being the highest rated at 3.6 on a scale of least effective (1) to most effective (5). The next most effective platform is YouTube at 2.5, Instagram at 2.4 and TikTok at 1.9.
While trimming and shoeing videos continue to rise in popularity online, viewers are not typically potential clients, fellow farriers or even equine enthusiasts. Social posts and videos by farriers aimed at clients typically provide business information or are broadly educational in nature. The most widely engaged posts are usually those sharing detailed educational material to fellow farriers. This is how many gain a deeply rooted follower base. Still, acquiring clients from social media remains largely elusive. In the data, there was no correlation between social media promotion and income.
When marketing their business, 81% of respondents use a mobile device and 31% also use a computer. Only about 16% use pen and paper or physical methods of advertising. Social media is similar in that most respondents (89%) use their phones and 30% use computers. Ordering supplies is also largely done via mobile device at 67% of respondents, likely due to its immediacy and convenience.
For other business maintenance activities, such as scheduling, invoicing and keeping horse records, the preference remains for pen and paper. Since 2024, respondents have been moving away from using phones and computers for scheduling and invoicing.
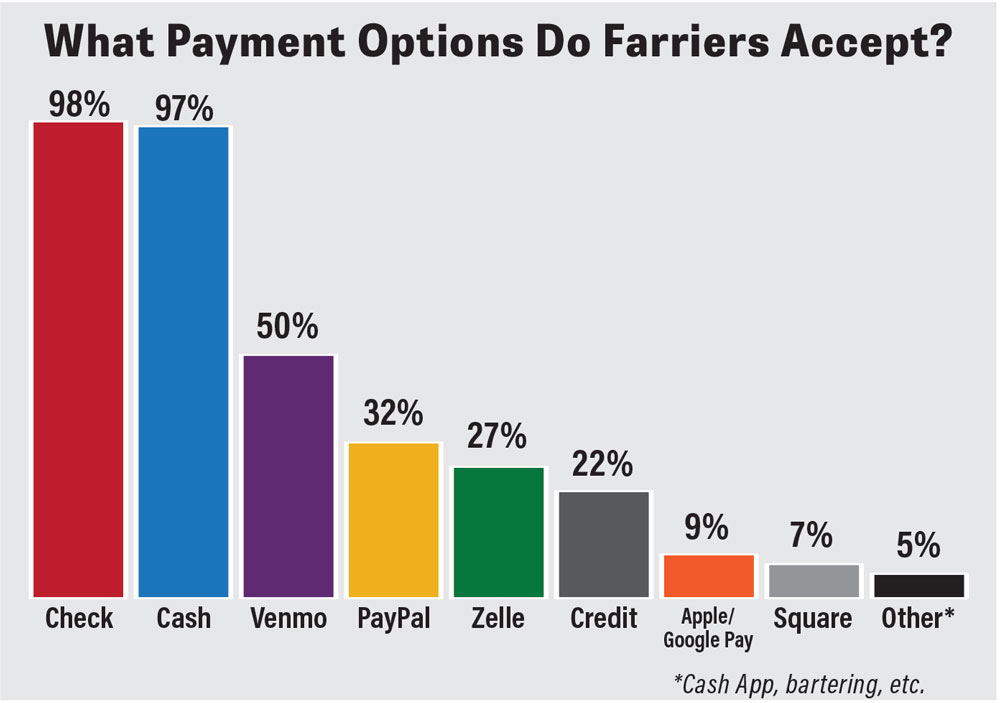
In line with previous surveys, checks and cash are the most universally accepted forms of payment, with 98% accepting checks and 97% accepting cash. The next most popular form of payment is Venmo at 49%, followed by PayPal at 32%, Zelle at 27% and credit cards at 21%. Other options include Apple and Google Pay, Square and CashApp. The frequency of each payment type decreased slightly from 2025, indicating more diversification in payment options that farriers accept.
Regionally, there is some variation. The Far West and West still prefer cash over checks, with the two tying for first in the Northeast and Central regions. In third, the West, Central and Northeast differ from the national preference for Venmo in favor of Zelle in the West and PayPal in the Central and Northeast. The fourth most preferred payment is PayPal nationally, but in the Far West, Southwest and Northeast it’s Zelle, and in the Central region it’s credit cards. This is likely due to regional payment culture differences rather than a superiority of one digital payment method over another.
Income & Charges for Services Shift
Since 2024, the average annual income has risen by $20,000 from $115,457 to $135,736. Over the years, farrier income has risen and fallen due to changing business practices and economic conditions but has remained above $100,000 since 2020. When American Farriers Journal first began collecting data in 1989, the average farrier was making around $35,000 per year — about $97,339 in today’s dollars.
Regionally, income varies significantly. Similar to 2025, farriers in the Northeast make the most money at $152,500, then the Southwest, Southeast, Central, West and finally the Far West at $114,600 in annual average income. This is a slight shift from the previous survey, where farriers in the Central region made more than those in the Southeast and the Far West, slightly more than the West. Discrepancies can be attributed to a shifting sample size of farriers, fluctuations in charges and shifting business practices.
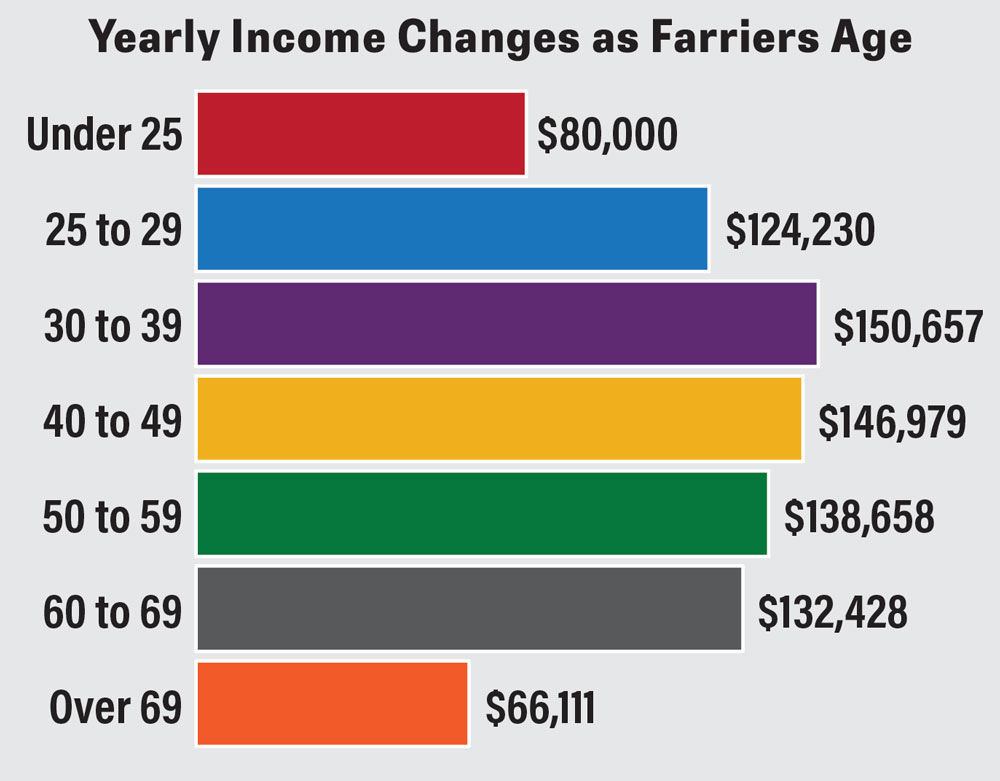
As farriers get older and gain more experience and visibility, many can charge more. This is reflected in the data that shows farriers often make more money as they age. Those younger than 25 make an average of $80,000 before expenses each year. Moving up to the 25-29 range, farriers begin making $124,230. It rises again to $150,657 for farriers ages 30-39, after which it begins to decline again. Farriers aged 60-69 make an average of $132,428, and farriers older than 69 make $66,111, $14,000 below their youngest counterparts.
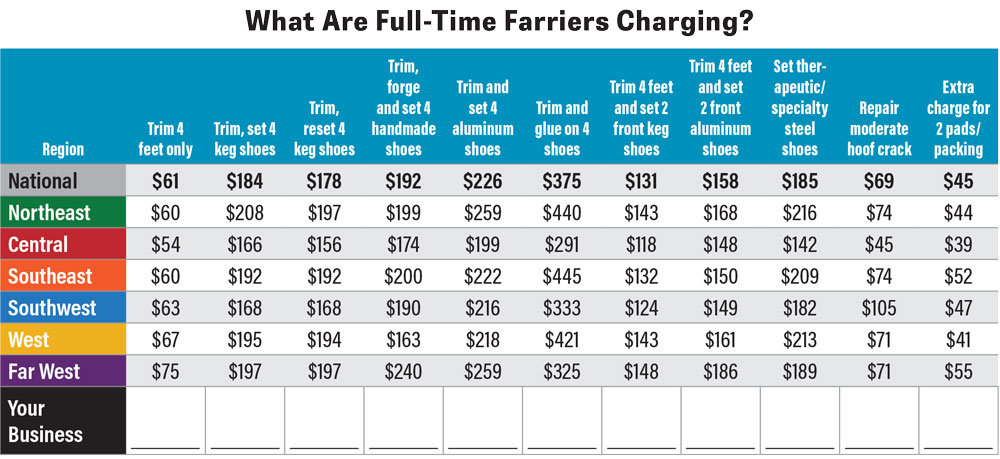
Because income is in large part determined by charges for services, it’s important to also look at how farriers set their prices. A trim costs a client $61, a trim and four keg shoes $184 and a trim and a full reset $178, which are all increases from the previous survey. The charge for four handmade shoes has gone down from $239 to $192, glue-ons from $416 to $375, therapeutic or specialty steel shoes from $198 to $185 and repairing a moderate hoof crack from $82 to $69.
However, the charges for four aluminum shoes have increased slightly from 2025 to $226, the charge for two front keg shoes to $131, for two front aluminum shoes to $158 and for pads and packing to $45.
For the most part, regional charges have increased across the board. However, the Central region has seen the most decrease year over year. Though farriers’ income has still increased in this region, this could simply be due to taking on more horses than in previous years.
In every region, the cost of four handmade shoes has decreased anywhere from $35 to $60. The cost of repairing a moderate hoof crack has also decreased in the Far West, Central, Southeast and Northeast regions.
The Far West and Northeast usually charge slightly above the national average, while the Southwest and Central regions tend to charge at or below the national average.
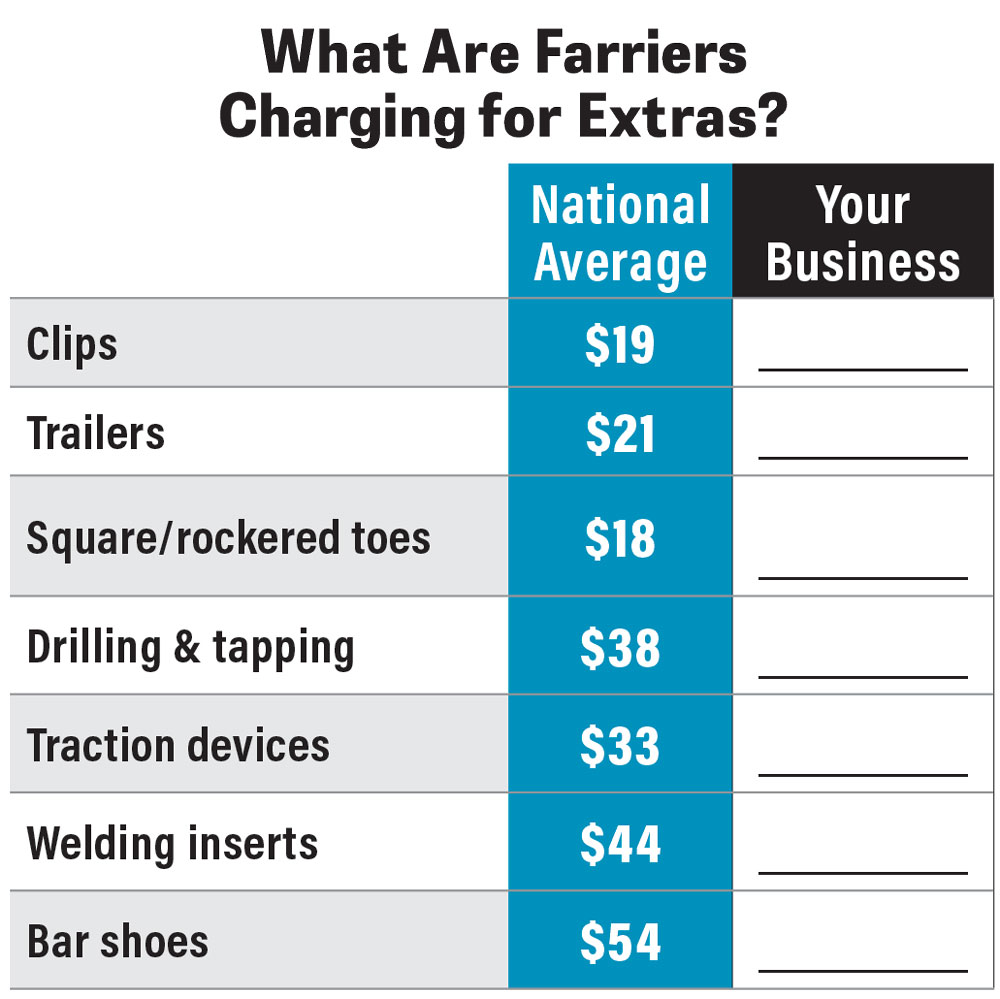
Charges for extras have remained similar year over year, with the most significant changes being a $10 drop in the cost of welding inserts to $44 and a $7 increase in drilling and tapping to $38. The highest national extra charge is for bar shoes at $54 and the lowest for clips at $19.
Though there are outliers in every category, it’s important to compare your practice to both the national average and regional average to determine how your business can remain competitive and profitable.
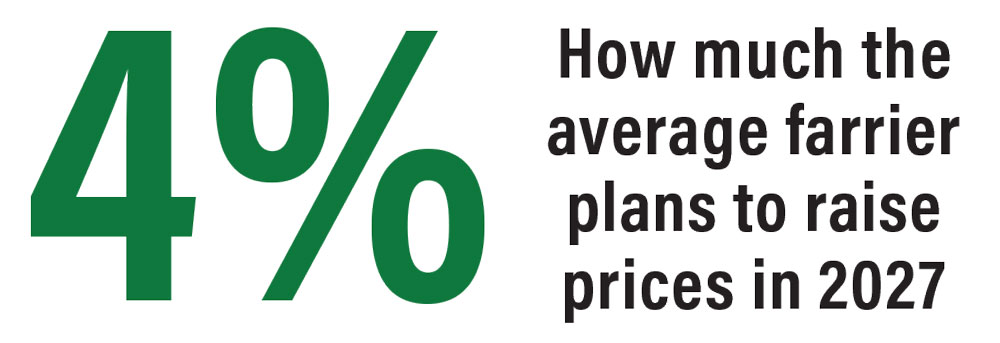
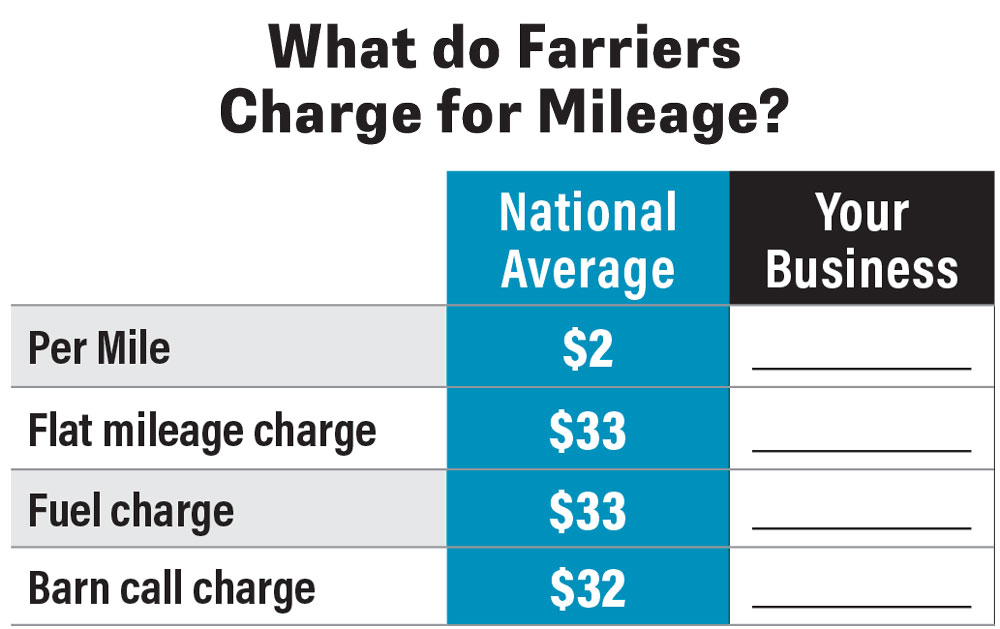
Anticipating a changing economy, farriers plan to raise their prices by 4% in 2027, consistent with 2025 and 2024 respondents. With that in mind, farriers anticipate their income at the end of 2026 to be $139,784. For those who charge for mileage or fuel, the plan is for a 2% increase. Currently, per-mile charges, flat mileage charges and barn call charges all decreased slightly from 2025, while the fuel charge increased slightly to $33.
Who Is The Typical American Farrier?
Across the United States, hoof-care professionals operate unique and diversely specialized businesses. In order to continue to be successful, it’s helpful to compare your operation to your neighbor’s, decide what works and reassess what doesn’t.
Using data from farriers across the country, American Farriers Journal compiles a picture of who the average American full-time farrier is and how they run their business.
The majority of full-time farriers are 47-year-old men who work 40 hours per week across 5 days, which is consistent with the previous year’s data. Since 2024, the percentage of women working as farriers has dropped by half from 20% of respondents in 2024 to only 10% in 2026. This is still higher than in surveys past, and the percentage of women in the industry has remained around 10% or higher since 2020.
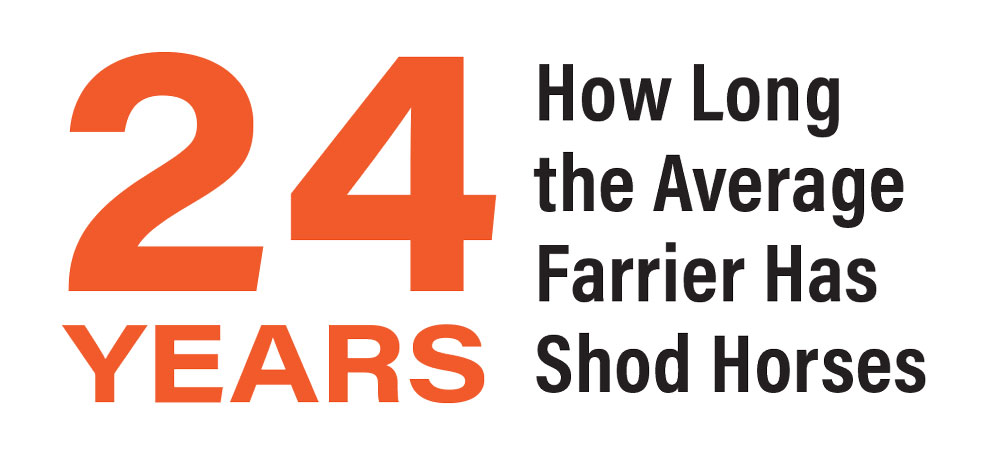
The average farrier has also shod horses for 24 years, meaning many were 23 when they tacked on their first shoes. Current full-time farriers say that of those 24 years, 20 have been spent as a full-time horseshoer and 4 as a part-timer, which can be explained by aging farriers choosing to step back or by newcomers trying to break into the industry.
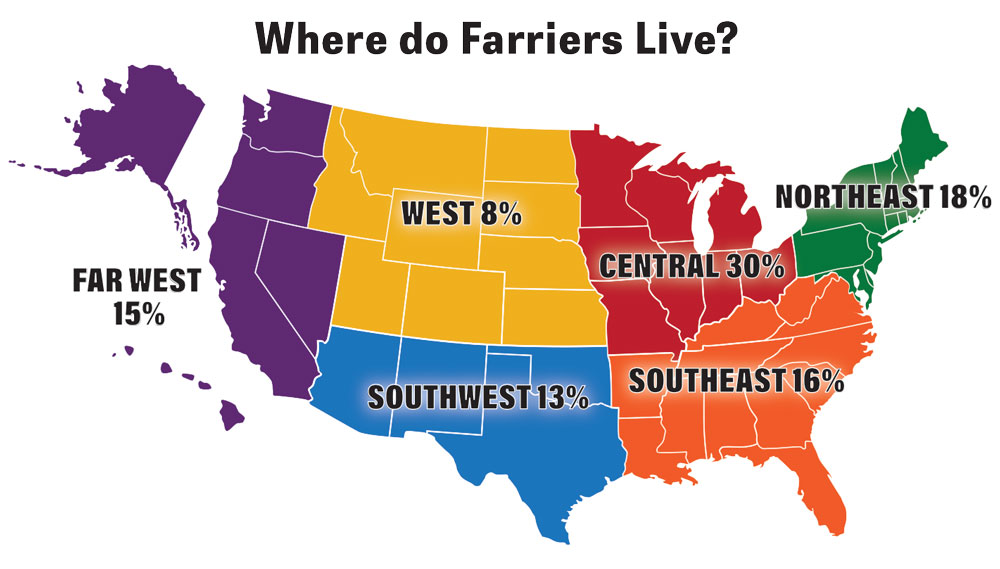
Regionally, the fewest farriers live in the West — which includes Idaho, Montana, North and South Dakota, Wyoming, Utah, Colorado, Kansas and Nebraska — at only 8% of respondents. The Southwest — including Arizona, New Mexico, Oklahoma and Texas — represents the next lowest percentage of farriers at 13%. The Far West — Alaska, Hawaii, Washington, Oregon, Nevada and California — is home to 15% of farriers. The Southeast — West Virginia, Virginia, North and South Carolina, Kentucky, Tennessee, Georgia, Alabama, Mississippi, Arkansas and Louisiana — holds the next highest percentage of farriers at 16%. This is, however, lower than 2024 by 9%.
While previously mentioned regions remained static, the Southeast, Northeast and Central regions all experienced demographic shifts. While fewer farriers call the Southeast home year over year, the Northeast and Central regions boast an increase in farriers.
The Northeast — encompassing Maine, New Hampshire, Vermont, Massachusetts, Connecticut, Rhode Island, New York, New Jersey, Pennsylvania, Maryland and Delaware — is home to 18% of farriers, up 4% from 2024. In addition, the Central region — Minnesota, Iowa, Missouri, Wisconsin, Illinois, Indiana, Michigan and Ohio — holds the highest percentage of farrier respondents at 30%. This is up significantly from 2024, when it held 19% of horseshoers.
Of the regional historical data available, there have been some shifts since the 1990s. Typically, the West or the Southwest regions of the country are home to the fewest farriers, while the Northeast and Central regions are home to the most. Whether due to changing economic conditions, regional horse populations, culture or simply personal preference, farriers may move when times are tough or when a better opportunity presents itself somewhere else.
While the average farrier is likely to be found in the Midwest, they are also likely to have apprenticed with another farrier. Similar to the previous year, 70% of respondents spent time as an apprentice — 10% above the historical average — which may help account for years spent as a part-time farrier. Of those who have apprenticed, the majority (28%) do so for more than 2 years. There is a nearly even split between those who apprenticed for less than a year, 1 year and up to 2 years at about 14% each. Apprenticing for 2 or more than 2 years is the most common at 42% of respondents, consistent with previous years.
Despite 70% of farriers spending time as apprentices, only 23% normally mentor others. Still, the desire to pass shoeing knowledge on to the next generation has grown 4% since 2025. Of those who regularly mentor others, 62% of apprentices stay for 2 or more years. Looking at historical survey data, the average has held at around 26% of farriers who typically take on apprentices for or more years.
Apprenticing has its upsides. Overall, those who apprentice for any length of time report making $144,508 per year — $10,000 above the national average — while those who don’t report an income of $116,900. Respondents who have apprenticed for a year or less make around $142,000, while those who apprentice for 2 or more years make $146,000, a positive upward trend.
By contrast, 61% of respondents have attended farrier school, which is down 5% from the previous year. Among past surveys, the average is 70%. This may reflect a shift toward mentorship over formal education.
Since American Farriers Journal began collecting this type of data in 1989, the number of farriers who’ve attended a horseshoeing school and those who’ve apprenticed has shifted. School attendance rates reached a high of 74% of farriers in 1988, while apprenticeship rates hit a low that same year of 50%. In 2026, school attendance reached a historic low, while apprenticeship rates have remained at 70% of respondents or higher since 2020 — with a high of 74% in 2023.
Of the data available, rates of general education have also shifted compared with previous years. There was an increase in the number of farriers who did not complete high school, from 12% to 21% in 2026, an historical high. Rates of farriers with associate’s and bachelor’s degrees have also reached historic lows at 13% each. Those with GED equivalents, master’s and doctorate degrees have remained within average ranges at 48%, 3% and 2%, respectively. Combined with shifting preferences away from attending a farrier school, it makes sense that farriers would also be less inclined to attend formal educational institutions.
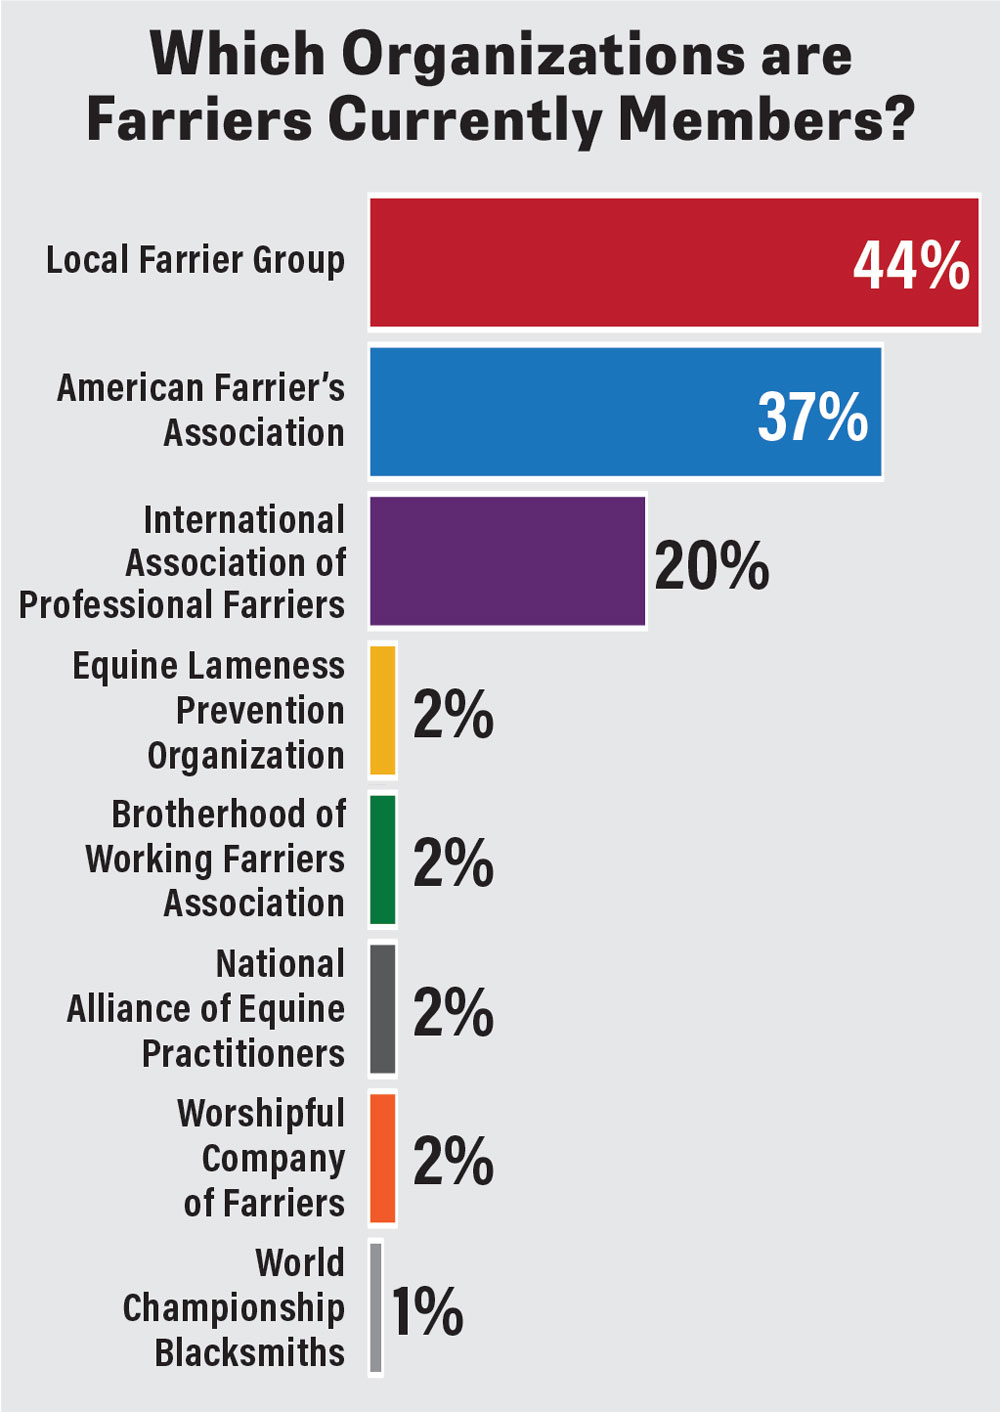
At the same time, the percentage of horseshoers who are part of a local farrier group has been trending up since 2024, from 37% to 44%. The average farrier also attends four clinics per year and spends slightly more per year on continuing education than previously. While attendance may be trending away from brick-and-mortar schools, the desire to learn has not diminished.
An Average Week of Horseshoeing
Respondents reported working with an average of 16 clients and 46 horses per week. This averages out to a little more than one horse per hour and just over three clients per day — or about 6-7 horses per day. Historically, a farrier’s work week hasn’t changed much since 1988. With a few outliers, the number of clients per week has remained between 12 and 17 and the number of horses per week between 26 and 48.
This is an increase in clients and a decrease in horses year over year, causing farriers to drive more to reach additional barns. Up from 370 miles, farriers now drive an average of 418 miles per week — 84 miles per day — within a 58-mile radius of home. Farriers in the Southwest drive the most on average, traveling 516 miles per week. In the Far West, weekly commutes amount to 309 miles. Historically, the number of miles driven per week has varied but often remains between 300-500.
The type of hoof care that farriers travel to perform varies based on the unique trimming and shoeing needs of a diverse range of horses. For the average farrier, it means an even split between trims alone and trims and shoeings, up from a 46:54 ratio the previous year. It also means therapeutic work. For those who don’t refer out specialty work, this amounts to 80% of one day each week spent on therapeutic cases. During that time, 60% of respondents say they worked in consultation with an equine vet more than 50% of the time.
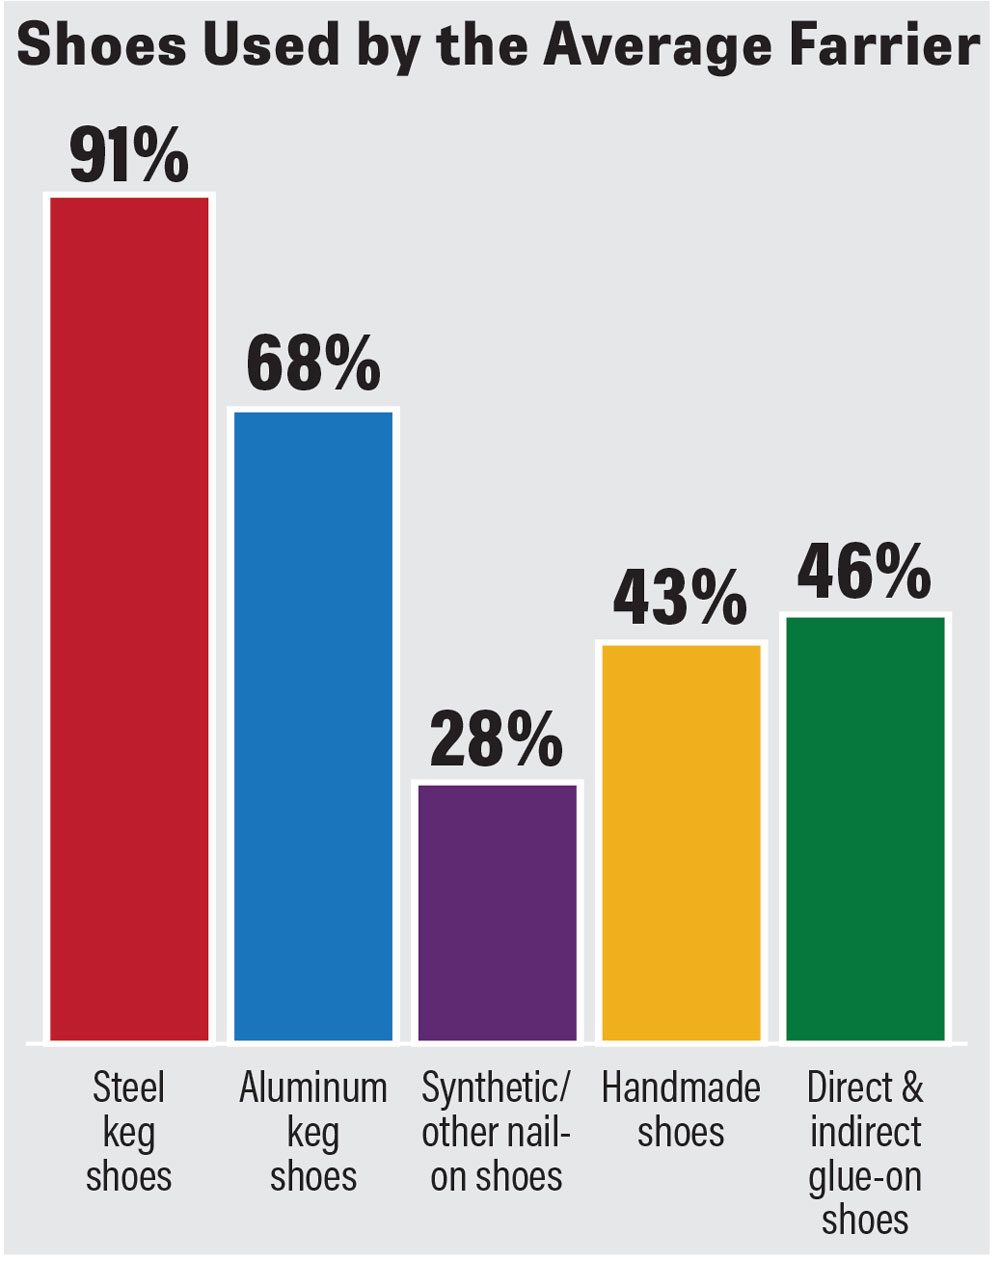
Depending on the needs of the horse, there are a multitude of shoe options available to farriers. Over the course of a year, 91% of farriers use steel keg shoes, 68% use aluminum shoes, 28% use synthetic or other nailed-on shoes, 43% use handmades and 46% use direct and indirect glue-on shoes at least once.
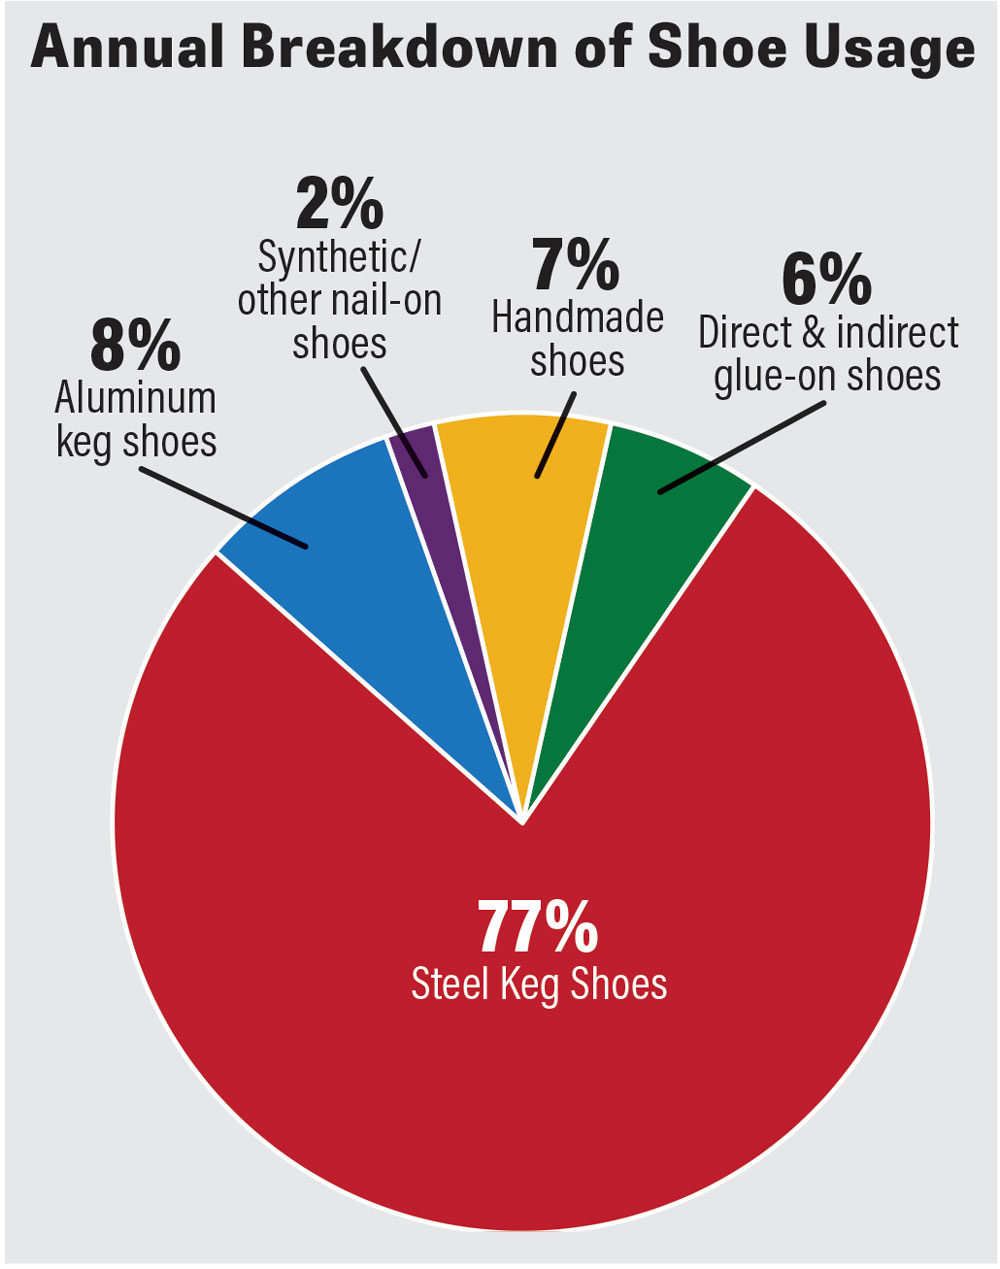
However, the frequency at which these options are used is much different. Steel keg shoes account for 77% of yearly shoe usage, aluminum keg shoes 8%, synthetic shoes 2%, handmade shoes 7% and glue-ons 6%.
With 46 horses worked on per week and 50% in shoes, that comes to 23 horses shod per week. Among these 23 horses, 18 are shod with keg shoes, one to two each with aluminum shoes, handmades and glue-ons and one every 2 weeks with synthetic nailed-on shoes. Since 2024, the use of steel keg shoes has increased from 70% of shoeings to 77%, and handmades have increased 2%. Meanwhile, the use of aluminum shoes has declined by 5%, synthetics by 2% and glue-ons by 2%.
Regionally, steel keg shoes are still the most popular option, not dipping below 71% of total usage in the Southeast or rising above 85% in the West. Along with the lowest use of steel keg shoes, the Southeast also has the highest use of glue-ons at 12% of all shoes. The West, conversely, uses the fewest glue-ons at 1% of total use. The Southwest uses the largest amount of aluminum shoes at 13%, the Southeast the most synthetic nail-ons at 4% and the Northeast the most handmades at 11%.
The average full-time farrier hot fits 48% of their horses, a jump from 41% the previous year. The West sees the highest percentage of horses hot fit at 60%, while only 32% of horses are hot fit in the Southwest.
Looking at clips, 42% of horses received side or quarter clips, and 19% got toe clips, which are increases of 5% and 3% from the previous year. The Southeast uses the fewest clips, 18% side or quarter clips and only 8% toe clips. By contrast, the Northeast uses the most, with 55% receiving side or quarter clips and 26% receiving toe clips.
The most common way farriers achieve a clipped shoe — 46% of respondents — is simply buying it pre-clipped from the manufacturer. At 31%, farriers draw their own clips on keg shoes. Less commonly, 15% of the time, farriers modify pre-clipped shoes. The remaining 8% of the time, farriers are forging handmade shoes and drawing clips.
Since 2024, farriers have been leaning away from keg shoes clipped by the manufacturer, down 10% in 2 years. Nationally, modifying pre-clipped keg shoes is up 4%, forging handmades and drawing clips up 2% and drawing clips on keg shoes up 3%.
The Far West has seen the biggest drop in pre-clipped keg shoes from 68% to 40% and also the largest jump in drawing clips on keg shoes, from 20% to 38%. The Southeast uses the most pre-clipped shoes at 62% and the West the least at 31%. However, the West and the Southwest are the only regions that favor drawing their own clips over using pre-clipped keg shoes.
A clipped or unclipped horseshoe isn’t always the only part of a shoeing package. Often, other products, such as acrylics and hoof-repair materials, pour-in pads, non-metal shoes and pads are involved. Sixty-two percent of farriers report using pads weekly, followed by pour-in pads at 27%, acrylics and hoof-repair materials at 26% and glue-on, plastic, synthetic or other non-metal shoes at 16%. In the Far West, farriers report using pads 68% of the time in their weekly shoeing. The region least likely to use pads is the Southeast at 51%. Compared with 2025, hoof-repair material usage has dropped from 31% of respondents to 26%.
Considering finances, farriers spend an average of $446 per week on equipment and supplies and make $2,610 in return. Each month, farriers spend $142 on continuing education materials or events such as clinics and contests.
Therapeutic Preferences & Hoof Issues
In line with last year, the average farrier spends 16% of their time on therapeutic shoeing. The region that spends the most time on therapeutic shoeing is the West at 21% of the average farrier’s practice. By contrast, the Central region spends the least time on specialty or therapeutic shoeing at 13%.
Only around 5% of farriers do not offer any type of therapeutic shoeing. For those who do, about 21% refer some work out to others, a drop from 2024, where 35% of farriers were offloading therapeutic cases.
Carriage, backyard, racing, hunter/jumper and Western performance horses show up most frequently in the average farrier’s therapeutic practice. Because backyard horses are most commonly seen in the average farrier’s practice, it stands to reason they would also be represented in proportionally higher rates of therapeutic work. Though carriage, racing, hunter/jumper and Western performance horses do not appear on as many farriers’ books, they are active and demanding disciplines that expose a horse to more strain that can lead to injury.
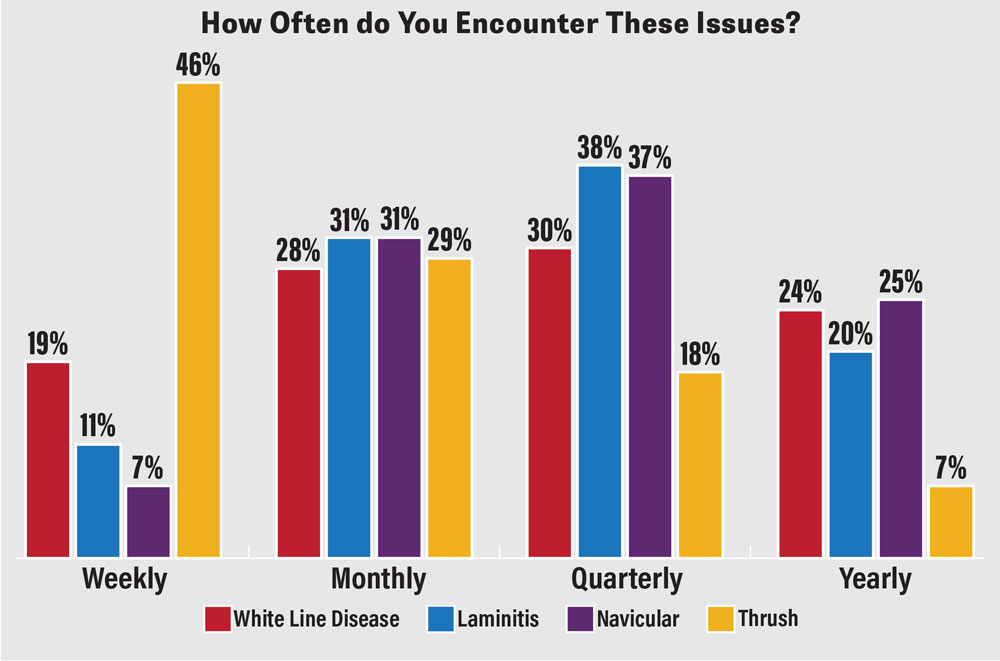
Rates of other issues — such as white line disease, laminitis, navicular issues and thrush — also fluctuate seasonally and are dependent on the sample of farrier respondents year over year. While 75% of farriers see thrush on a weekly or monthly basis, this is down from 80% the previous year. The frequency of navicular issues among respondents is up by about 3%, with most farriers seeing it quarterly (37% of respondents).
Laminitis is often seen on a quarterly or monthly basis by 69% of respondents, and weekly encounters are up 2%. White line disease is most likely to be seen quarterly, with another slight jump in weekly appearances from 14% to 19% of farriers. These trends are highly dependent on the horse, the environment and the farrier’s business.
For farriers whose practice includes therapeutic work, 45% work in consultation with a veterinarian more than 50% of the time and 15% every time. This is 5% down from the previous year. A quarter of respondents worked with vets between 25-50% of the time, 13% did so less than 25% of the time, and 3% reported never working with veterinarians on therapeutic cases.
Along with a slight downward trend of how frequently farriers work with vets, there is a slight increase in friction between vets and farriers from last year. Fifty-four percent of farriers report having a great relationship with their vet with no problems, down from 61%. Thirty-nine percent report having a good relationship with few problems, up from 36%.
Common sources of conflict arise from a disagreement on a shoeing package, a lack of clear communication, scheduling or a vet’s perceived or lack of mechanical knowledge involving the foot. Though 93% of farriers have positive relationships with veterinarians, it’s important to address any common issues for the betterment of the horse.
Hoof-Care Pros Preparing Less for the Future
Operating a successful business also means preparing for the future. Eventually, all farriers shoe their last horse. Whether because of an injury or retirement, it’s important to anticipate this and lay the groundwork for life’s inevitabilities early.
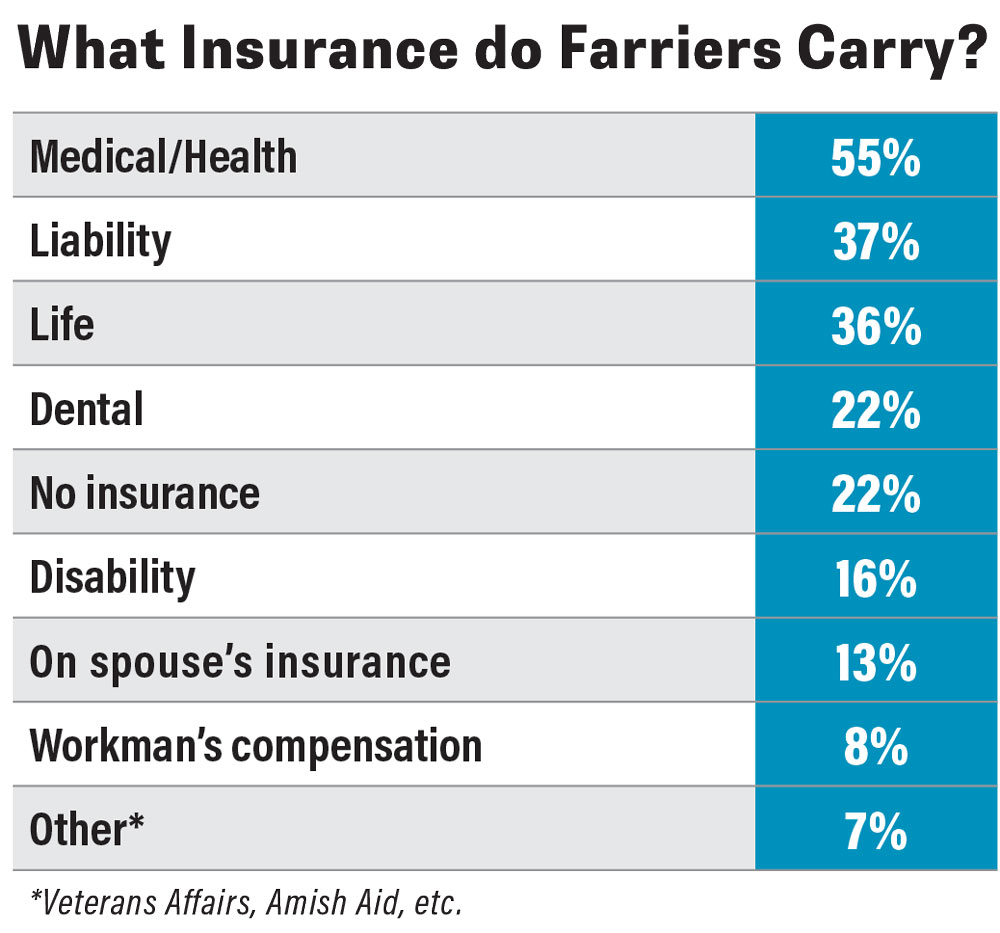
Only 55% of full-time farriers carry medical/health insurance. This is down 21% from 2024. Liability and life insurance are the next most commonly carried at 37% and 36%, respectively. Around 21% carry dental insurance, 16% carry disability insurance, 13% are on their spouse’s insurance and 8% have workman’s compensation. Compared with 2025, farriers without insurance are up across the board, and 22% do not carry insurance at all, a 9% increase.
Seven percent carry other options, such as Amish liability aid, small business aid, and Veterans Affairs insurance. The Southeast has the highest rates of farriers with medical/health insurance at 71% of respondents, while the Northeast has the highest number of farriers with no insurance at 33%.
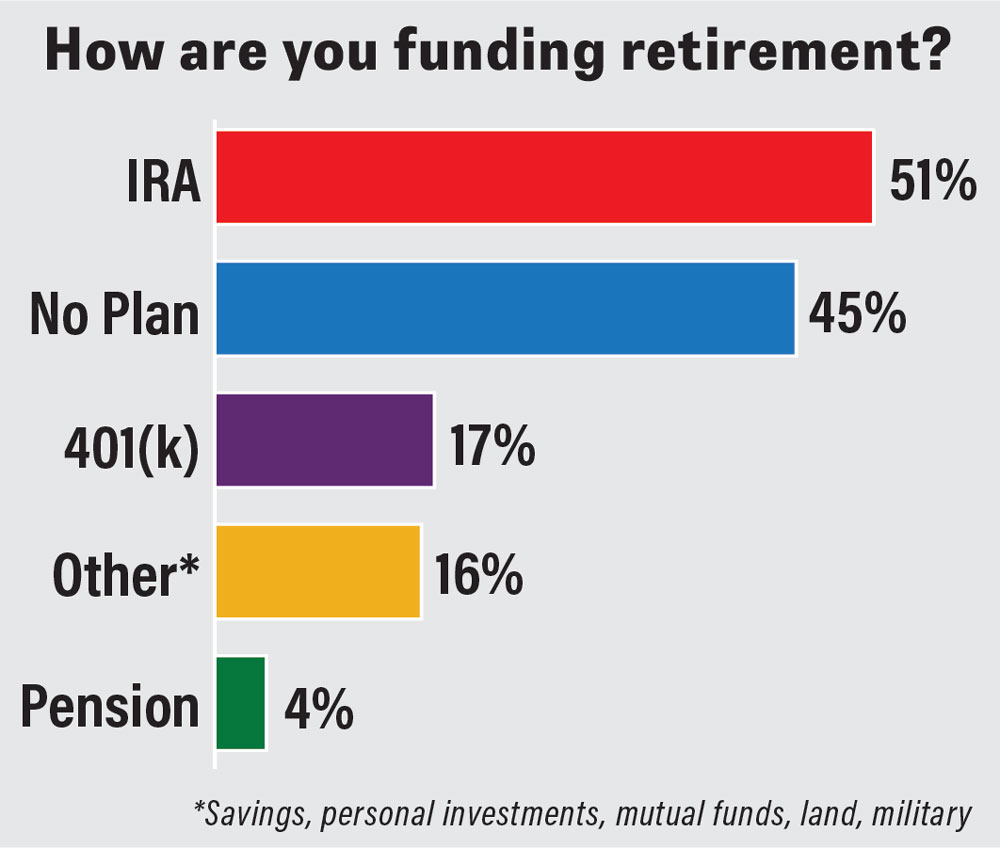
Looking forward to retirement, 56% of respondents have some type of retirement fund, a drop of 7% from 2025. The most common is an IRA at 51%, consistent with the previous survey. Pension plans have decreased year over year, while respondents with a 401(k) has increased. Other popular options to fund retirement include a high-yield savings account, an investment portfolio, owning land or a farm and owning rental properties.
Whatever options farriers decide, it’s important to start early and stay consistent to maximize the potential of your retirement fund. Thirty-nine percent of farriers report starting to set money aside for retirement in their 20s. Another 35% in their 30s.
The average amount saved is $169,872, up slightly from the previous year. There is no correlation between farriers’ satisfaction with their retirement funds and age or income. Retirement planning is extremely dependent on the individual’s needs and goals.
Sourcing Product Information
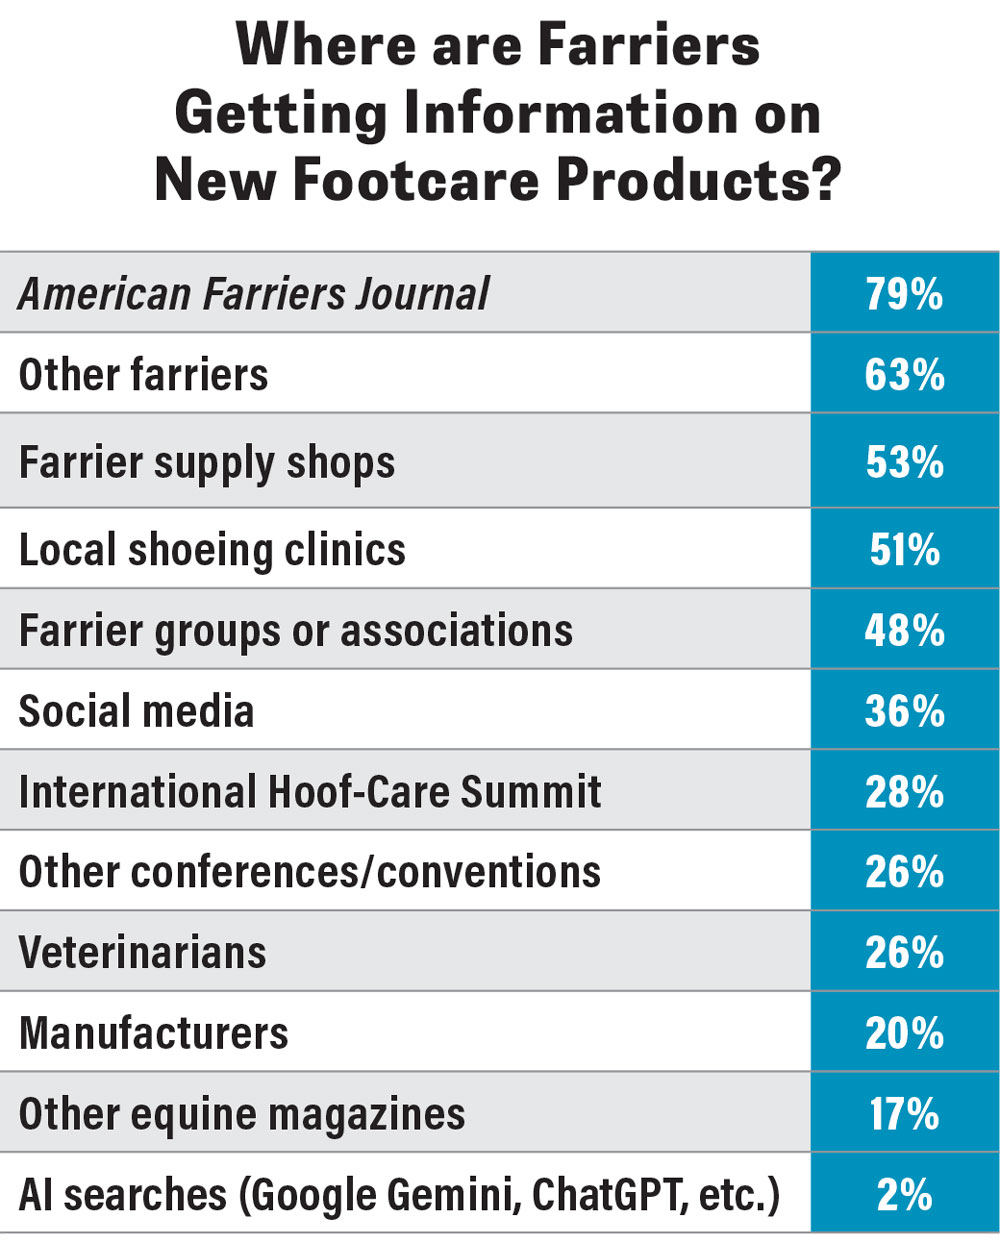
Seventy-nine percent of survey respondents get their footcare product information from American Farriers Journal. Among other resources, the most common are other farriers at 63%, supply shops at 53%, local clinics at 51% and farrier groups and associations at 48%.
Many other sources of information remain within a few percentage points each year. However, between 2025 and 2026, using manufacturers as a source of footcare product information dropped by a third to 20% of respondents.
A new option for sourcing product knowledge was also added to the survey this year. Two percent of respondents say they use AI searches such as Google Gemini, ChatGPT and others for their footcare product information. Additionally, 36% of farriers report using social media as a source of product information over other general equine magazines, veterinarians, conferences and conventions.
When purchasing products, 93% of the time it’s with a farrier retailer. The next most common is wholesaler direct at 16% of the time, then manufacturer direct at 10%. Tack stores, hardware stores, feed stores and big box stores such as Tractor Supply are used less than 10% of the time, down from previous years. Tack stores saw the biggest drop at nearly 10%. Regionally, answers vary. In the Far West, West and Southwest, feed stores come in second behind farrier retailers.
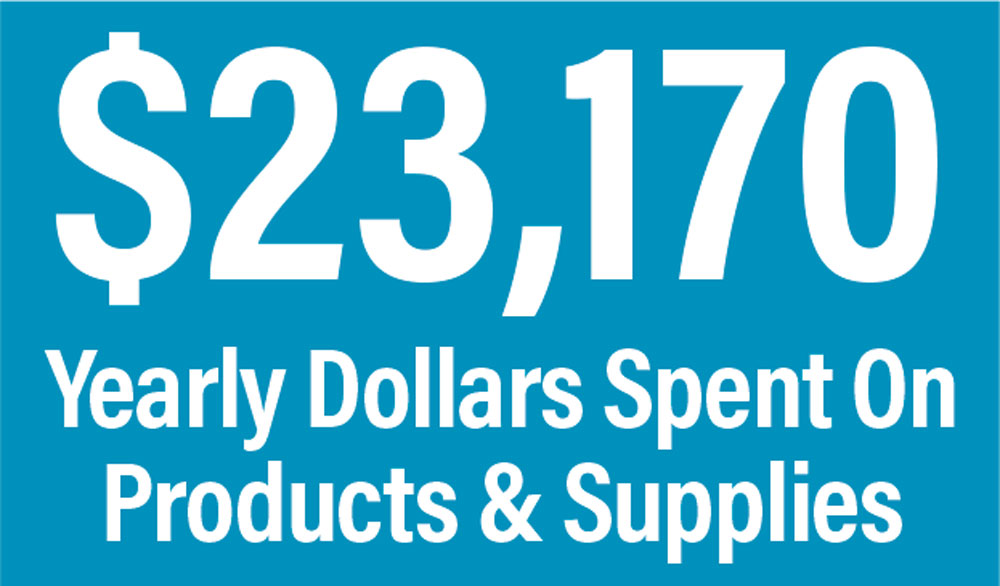
Overall, farriers spend an average of $23,170 on equipment and supplies each year, up $3,000 from the previous year. The Southwest spends the most annually at $32,269, which is up $12,000 from 2025. The Southeast spends the least on supplies at $19,483, an increase of $4,000. Despite the complications of tariffs, inflation and the rising costs of goods, the Far West, West and Central regions have all reduced their annual total expenses by $1,000 to 2,000.
Avenues for Continuing Education Change
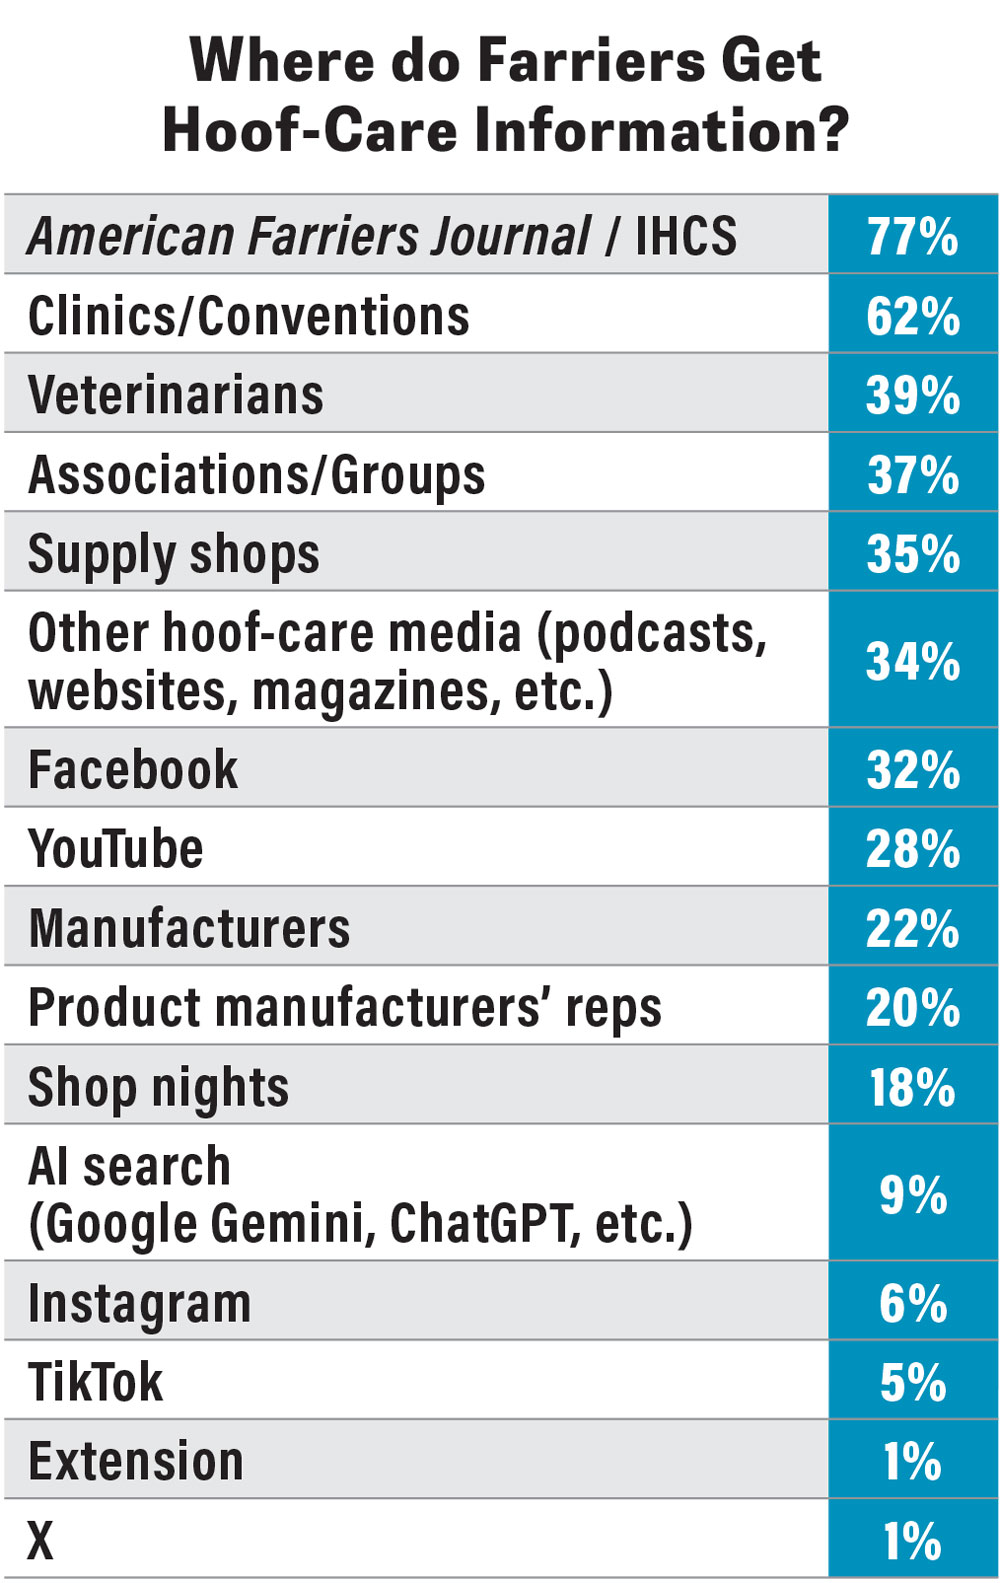
Over three-quarters of full-time farrier respondents get hoof-care information from American Farriers Journal and the International Hoof-Care Summit. The next most common sources of information are clinics and conventions at 62% of respondents, followed by veterinarians at 39%, associations and groups at 37%, supply shops at 35% and other hoof-care media — such as podcasts, websites and magazines — at 34%.
Facebook is a major source of hoof-care education for 32% of respondents and YouTube for 28%. However, Instagram, TikTok and X are less common at 6%, 5% and 1%, respectively. Since 2025, hoof-care information from supply shops, shop nights, product manufacturers’ reps and manufacturers has increased 2-7%. Despite increased interest in these offline educational opportunities, Facebook and YouTube beat out product manufacturers’ reps and manufacturers as preferred sources of information.
In a reversal from the previous survey — while still popular and convenient tools — farriers are turning to more in-person educational events than online sources.
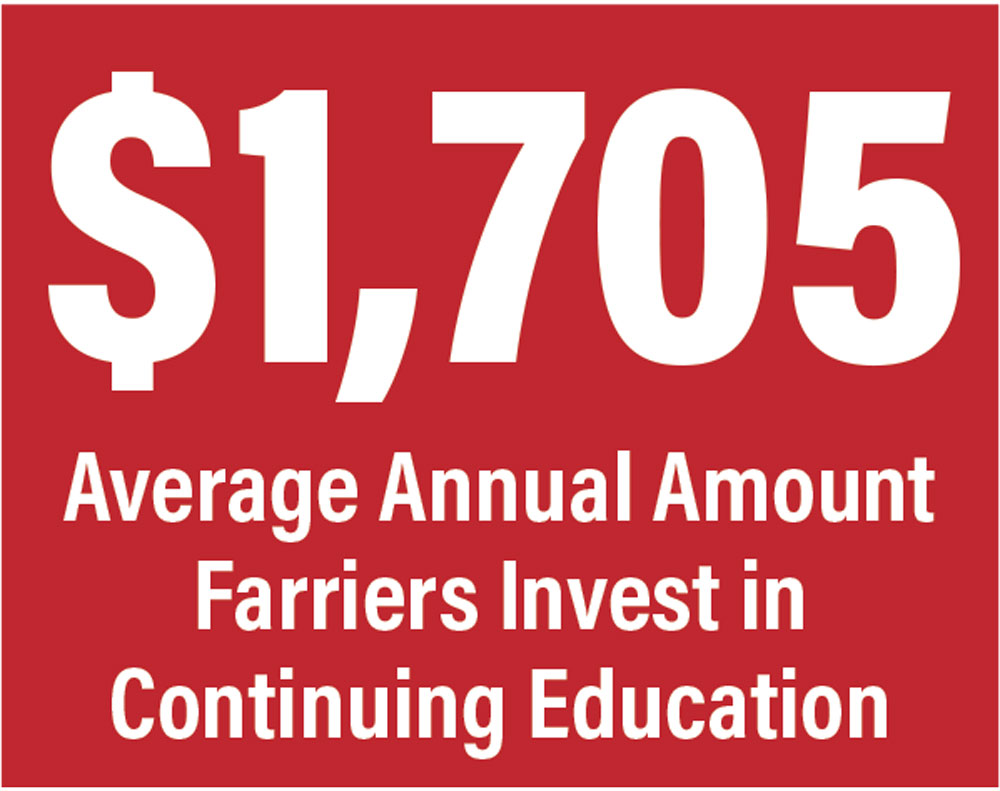
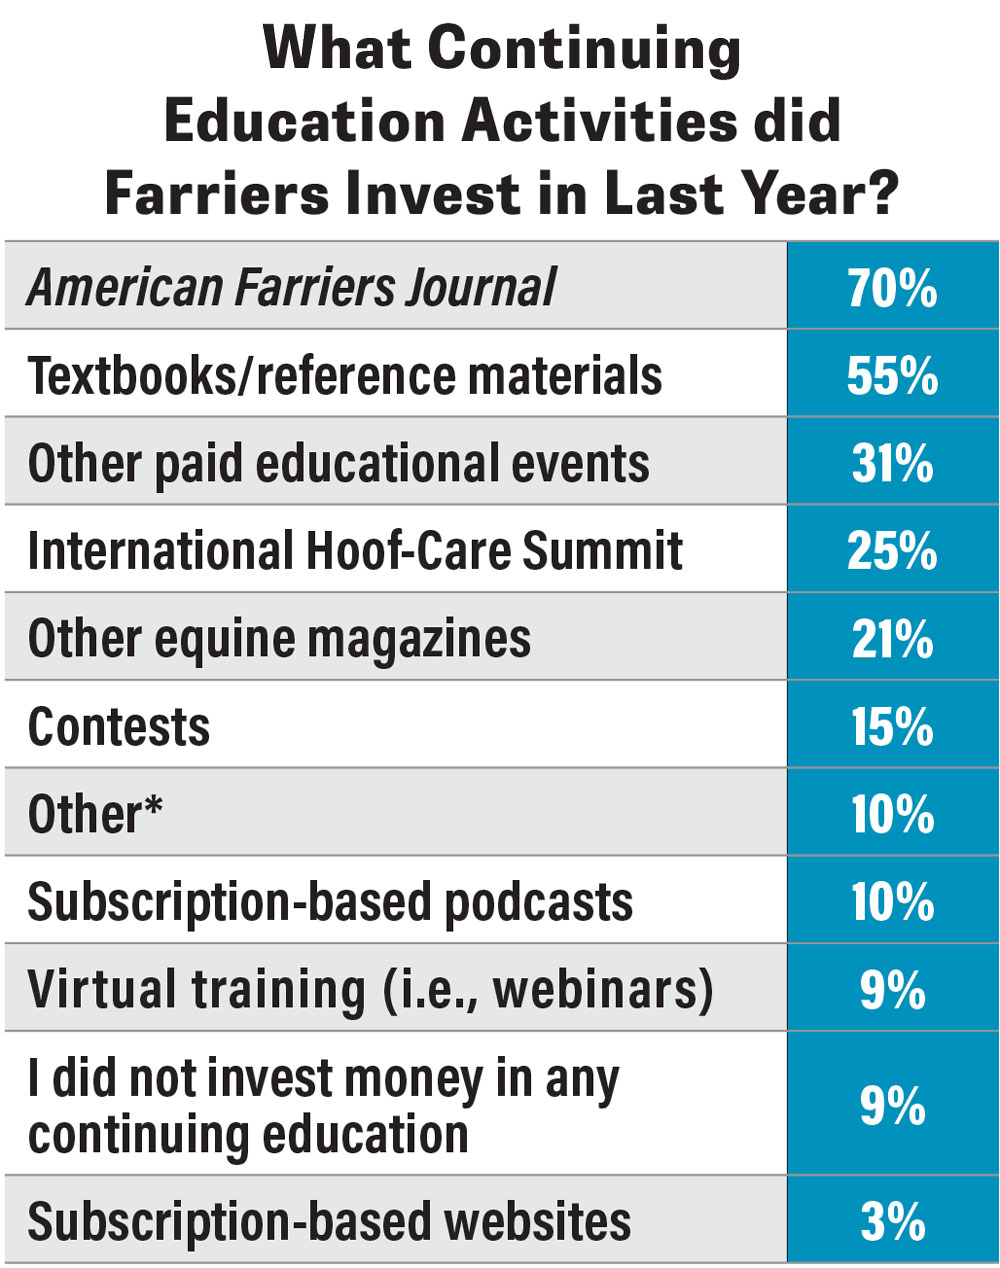
Farriers report spending an average of $1,705 on continuing education throughout the year — which is up only slightly from 2025 — or about $142 per month. Respondents are most likely to spend the money on American Farriers Journal (70%), textbooks and reference materials (55%), paid educational events such as clinics or conventions (31%), the International Hoof-Care Summit (25%), other equine magazines (21%) and contests (15%).
When farriers attend contests, conventions and clinics, they’re typically attending one contest, one convention and four clinics in a year — double the number of clinics from the previous year.
Another great way to continue your education is to join a farrier organization. Since 2024, membership in local farrier groups has increased from 37% of respondents to 44%. Thirty-seven percent of respondents are American Farrier’s Association (AFA) members and 20% are members of the International Association of Professional Farriers (IAPF).
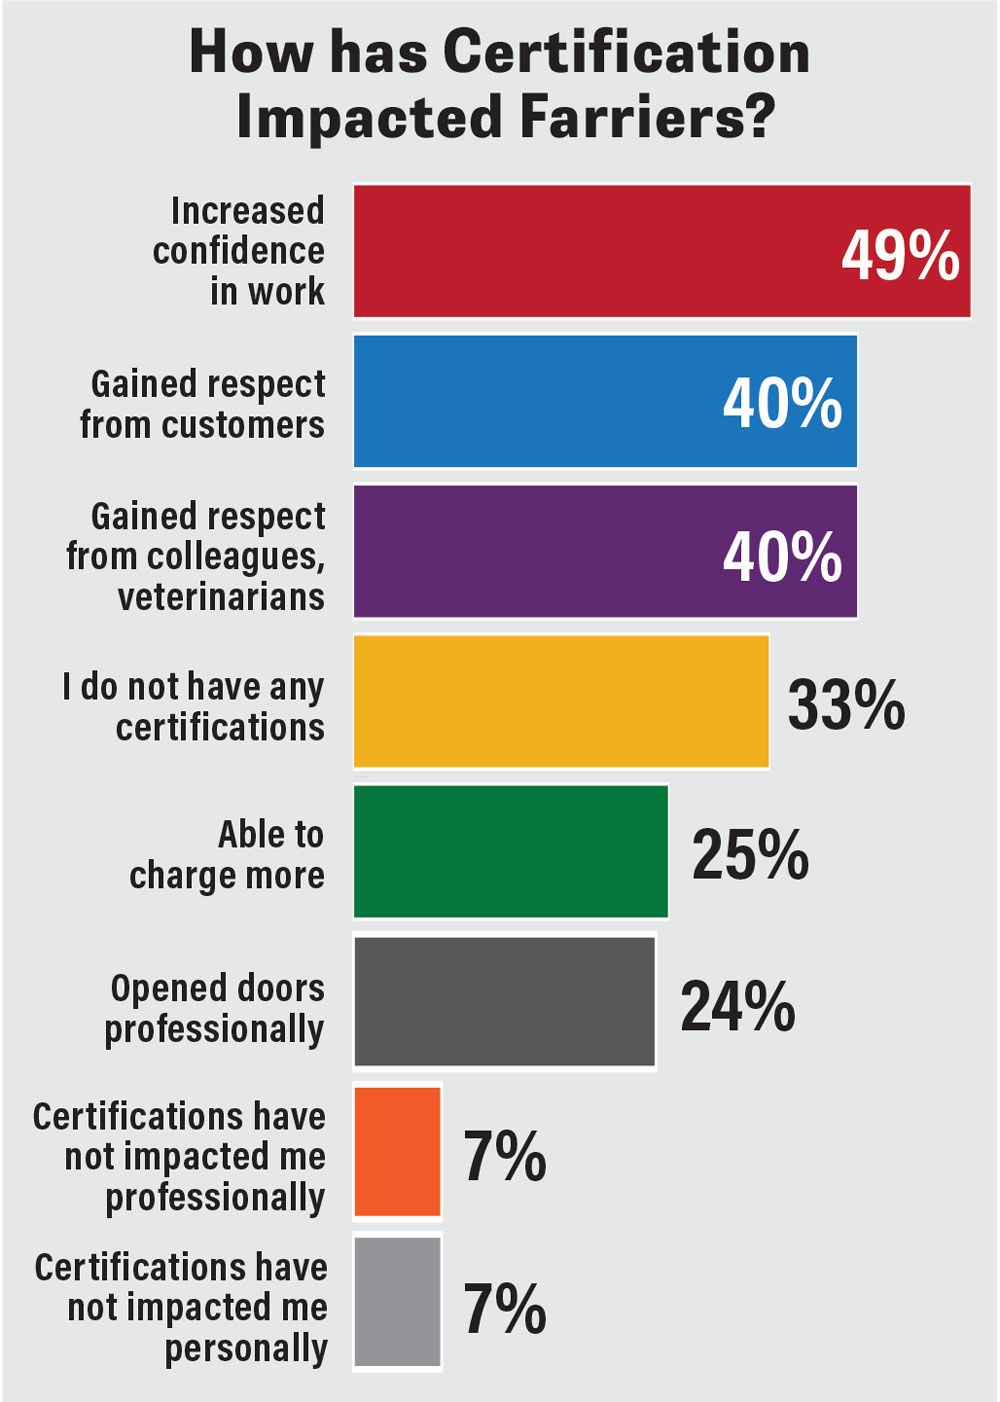
Thirty years ago, only 17% of respondents had earned their journeyman certification and 26% were Certified Farriers with the AFA. Today, 25% of respondents are Certified Journeyman Farriers and 54% are Certified Farriers. The next most common certification is Accredited Professional Farrier with the IAPF at 19%, followed closely by Accredited Professional Farrier with Foundation Credential at 18% and Accredited Farrier at 11%.
For those who have earned certifications, 73% report increased confidence in their work, up 18% from the year prior. Another 60% say they gained respect from customers, 59% from colleagues and veterinarians, up 19% and 13% respectively. For 37% of respondents, they found they were able to charge more, and for 36% it opened more doors professionally. All categories have increased significantly year over year, signaling positive reception of certification and a personal sense of accomplishment.