Abstract of the Study

The reason for performing this study: Breakover is a mechanically important part of the stance phase during which the horse prepares for the swing phase. It is the time between the heel leaving the ground until the hoof or hoof appliance, such as the shoe, leaves the ground during the terminal stance phase. This study will provide a better understanding of toe surface modifications and their impact on the speed of breakover, allowing the farrier and veterinarian to make better shoe choices based on evidence to which extent common shoe modifications influence this important part of the stance phase.

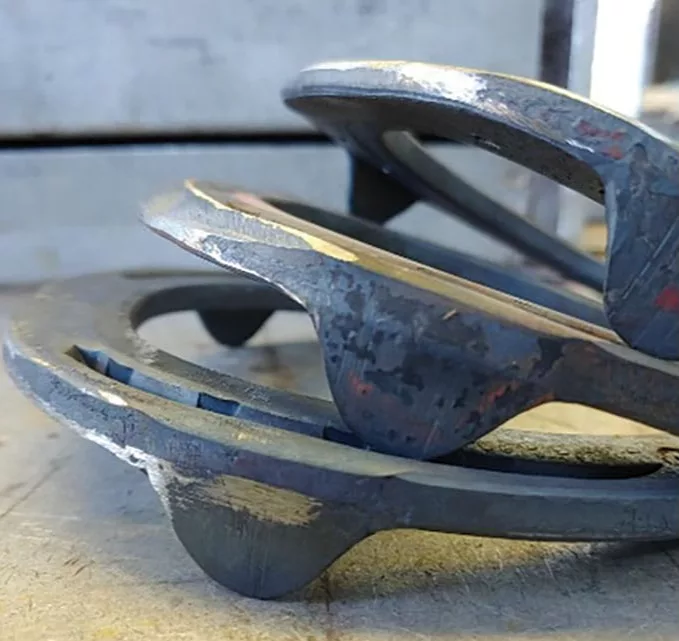
Objective. Test and quantify three common shoe toe-surface modifications: regular toe, rolled toe, rocker toe. Determine whether these modifications have an impact on the duration of breakover.

Methods. Small hoof-mounted accelerometers were attached to the hoofs of six sample horses. Each horse was examined on two surfaces (hard and soft) with three conventional shoe surface modification, (regular toe, rolled toe and rocker toe shoe), recording data for 10 seconds at 1,024 Hz. Data was exported to Excel3 and further evaluated with SPSS, version 261. A mixed model was implemented, with horses as random factor and shoeing conditions, and surfaces as the fixed factors. Level of significance was set to P<0.05 and a Bonferroni post hoc correction was used to test for pairwise significant differences between shoeing conditions.

Results. The results suggest that shoe surface modifications such as the rocker toe shoe do impact breakover duration. The rocker toe shoe spends a longer time in the breakover phase of the stride. All shoe toe-surface modifications (rolled and rocker toe) had shorter breakover time in soft footing (regular toe 0.069 seconds (s), rolled toe 0.072s, rocker toe 0.063s) compared to the hard surface (0.069s, 0.075s, 0.080s). The regular toe remained unchanged. Breakover time of the rocker toe was faster in soft footing (walk at 0.166ms and trot 0.164ms). While a longer duration was noted on hard footing, (walk 0.17ms and trot 0.080ms). P-values were significant for shoe surface conditions and surfaces for breakover walk and trot, stance walk and trot and stride walk only. For the variables measured for breakover walk and trot walk, shoe surface condition (P=0.019) Surface (P=0.040) and trot shoe surface condition (P=0.015) and surface (P=0.001). Breakover for the trot was the only phase that had significance for surface and condition together (P=0.010). Stride timing was the least impacted in the study.

Conclusion. This study illustrates the potential importance of shoe surface modifications as methods of optimizing breakover and the important influence of different footings.

Equipment References:

  • 1IBM SPSS, Version 26, London, United Kingdom
  • 2LORD Microstrain, Williston, Vt.
  • 3Excel 2010, Microsoft, Redmond Wash.
  • 4LabView, Version 2014, National Instrument, Austin, Texas
  • 5Equibond, Lord Corp., Cary, N.C. 

In recent history, shoeing has had two primary requirements: protect the hoof capsule and alter the horse’s performance (Adams and Stashak, 2002). When it comes to enhancing performance and altering kinematics, toe-surface modifications are of key importance in the veterinary and farrier professions (Hüppler et al., 2016). As a result, many scientific studies have looked into breakover and altered toe-surface geometry (Duberstein et al., 2013) (Bras and Redden, 2018). None have been conclusive, particularly regarding altering breakover speed. Kinematics has in recent years been of increasing interest, with the goal of evaluating the effects of these altered shoes and document their impact on equine locomotion (Eliashar, n.d.). The purpose of this study is to investigate one aspect of breakover; namely, the farrier’s ability to alter the time duration of breakover often referred to as the speed of breakover, by implementing shoe toe-surface alterations.

Biomechanical studies have traditionally employed optical motion capture systems for the determination of the position of an object in a room-based coordinate system. This constrains experiments to the calibrated volume of the camera system (although the cameras may move). This is not ideal for many types of study in locomotion since only a few strides may be collected per “trial,” and outdoor experiments are difficult with some systems (Pfau et al., 2005). In the past, researchers used the technology available to them, such as video with skin mounted markers (Clayton et al., 1991) (Boye et al., 2014) and others used IMU (inertial mounted measuring systems) (Stutz, Vidondo, Ramseyer, Maninchedda and M. Cruz, 2018). The reliability of these systems was less then optimal as skin mounted sensors move (Starke and Clayton, 2015). 

Additionally, the study of animal movement commonly requires the segmentation of continuous data streams into individual strides. However, when relying on optical methods, such as motion capture, there is a lack of validated robust, universally applicable stride event detection methods (Starke and Clayton, 2015). IMU placement was not able to be low enough on the limb, and did not have a sufficiently fast sample rate to detect the subtle effects of surface modifications on the shoes (Stutz, Vidondo, Ramseyer, Maninchedda and M Cruz, 2018). These studies noted the impact that the shoe had on limb movement only, not shoe-surface modifications. 

Other studies that included a kinematics portion were also suboptimal due to unnatural test settings such as tread mill (Keegan et al., 2005) and force plates, both of which are immobile and costly (Olsen et al., 2012). These and other studies show a need for greater field practicality, accuracy, range and proper location of measurement devices on the test animals (Kruse et al., 2012). Additionally, sport horses perform on multiple surfaces, complicating analysis. Studies have been done on the Thoroughbred racehorse with accelerometers to compare hoof acceleration and ground reaction forces all done on dirt, turf, and synthetic surfaces (Setterbo et al., 2009). Each surface presents unique problems to the shoe ground interaction, such as hardness, sheer strength and flatness. The equipment used was only partially satisfactory (Kruse et al., 2012). In the past, measuring techniques and environment may not be precise enough to record accurately the impact of shoe-surface modifications on speed change in breakover. 

P-value is the probability of obtaining a result at least as extreme as the one that was actually observed in the experiment or study, given that the null hypothesis is true.

Today, the use of accelerometers is a promising alternative for in the field gait analysis. Accelerometry turns out to be a better solution to measure events such as equine hoof slip on consecutive strides under real training conditions and different surfaces (Holden-Douilly et al., 2013). Also, hoof mounting provides clear and repeatable features during both hard and soft surfaces and represents the optimal site of accelerometer placement (Witte, 2004). Other researchers (Burla et al., 2014) used accelerometers to reveal a clear suitability for gait determination in horses. There results allowed for the definition of distinct acceleration values and ranges for standing, walking and trotting with Icelandic horses and other equids.

The farrier and veterinary industry have been in a constant search for shoeing techniques that will improve soundness, performance, and longevity of the working horse. The size of the United States horse industry is slightly larger than 9 million horses, and more than two-thirds are for sport, with an enormous economic impact (Anon., 2005). Any improvement in our current understanding of hoof mechanics, including breakover, will be invaluable in adding to comfort and longevity of our equine partners. The cost of top performance animals has dramatically increased. Improved health care has also increased the working life of the animals (Cozzi et al., 2017). 

In 2000, the average age of top U.S. equine eventing athletes at the Olympic Games was 12, top U.S. finishers at the 2002 World Equestrian Games were 16 years old. Treatment and management of the upper level sport horse has become increasingly challenging. Not only does this put demands on the veterinary industry, but increased pressure on the farrier industry to develop techniques to manage the older horse with potentially limiting hoof pathologies. 

The results of this study will lead the farrier and veterinary industries forward with a clearer understanding, and prompt investigation into other areas, such as shoe placement, trimming techniques (including hoof mapping) and altering shoe weight as viable methods to change speed of breakover.

Aims and Objectives

This study’s aim was to demonstrate that common shoe toe-surface modifications (regular toe, rolled toe, rocker toe) influence duration of breakover timing in the sport horse. It was hypothesized toe modification such as the rocker toe and rolled toe, designed to ease “breakover,” would lead to a reduction in duration of breakover. It was also hypothesized that the changes would be more pronounced on hard surfaces than soft.

To quantify the biomechanical effects, if any, and determine whether there is a sound and objective reason to continue their application. Research such as this is needed on these common shoe modifications. We need further understanding of breakover’s importance in typical working sport horse environments. 

Advances of technology, such as smaller, less costly, more capable equipment and methods of attachment to the hoof capsule. Improvements also include permanent mounted machined PVC fixtures, which will provide accurate location, and nearer to the center of rotation. The reduced size of the mount used makes placement easier and safer. 

Data will be collected in a controlled environment on flat level hard surface and contrasting artificial surfaces. With lower cost, as well as increased accuracy and range, detection of subtle changes in kinematics of shoe-surface modifications have on equine locomotion.

file name

Regular toe, rolled toe and rocker toe shoes.

Materials and Methods

This study design was based around the attachment of a small wireless accelerometer to the dorsal hoof wall of each “test” horse. A convenient sample of test horses was selected from the author’s business (Bear Metal Works) client list. The potential candidates were chosen by draw from a list of horses meeting inclusion criteria. Each qualified candidate had to fulfill the following inclusion criteria. Hoof size range from 14.0 cm by 14.0 cm to 15.0 cm by 15.0 cm to minimize conflicts in hoof mechanics that may arise due to size. Each horse was determined to be healthy and sound enough to perform normal work required for this study. Each animal was evaluated for correctness in conformation and any asymmetries were eliminated. Hoof angle ranged from 50 to 52 degrees. This project included six sport horses, in which the effect of change of speed on breakover as a function of shoe modification was measured. These were the measured modifications (Figure 1):

  • Regular toe.
  • Rolled toe.
  • Rocker toe.

All collection was done at one location to reduce any differences in measurements that may arise from, for example, change of footing or other environmental effects. All horses received each shoe conditions. This experimental protocol was reviewed and approved by the Royal Veterinary College Ethics and Welfare Committee (URN: 2019-1902-3).

Procedure

Each of the six horses was in a regular shoeing program of 4 to 6 weeks. The accelerometer was mounted to the center third of the dorsal hoof wall a half inch from the ground surface. The mounting device consists of 5 cm schedule 40 PVC pipe cut in 2.5 cm section. The PVC section was mounted with Equibond5 to the dorsal hoof wall. Each mount held one 40g triaxial accelerometer. Measurements were conducted on two different surfaces. A hard-flat asphalt like surface. The soft footing used in this experiment was a well-maintained indoor facility with a modern geotextile surface consisting of a mix of sand, rubber and loose fiber. Each horse had data collected on a straight line under each of the above conditions. A qualified handler assisted in each event. Both front feet were shod with the same shoes at the same time. Each horse was sequentially fitted with three different shoes, each with specific toe-surface modifications:

  • Regular toe: a commercial shoe of -inch by ¾-inch rectangular in cross-section with no surface alterations. 
  • Rolled toe: This shoe was manufactured by grinding a radius along the cranial border of the web of the shoe.
  • Rocker toe: This shoe will be forged bending the toe up to twice the thickness of the shoe. This shoe was applied last as it requires changes in the ground surface of the hoof to fit properly. 

Application of the rocker toe shoe requires the hoof surface rasped to accommodate the curvature of this modified shoe. All shoe fit and trimming will follow American Farrier’s Association guidelines. Shoe placement was critical for this study. The inside web of each shoe was placed 25 mm from the tip of the true frog, assuring consistent placement. After shoeing, the above-mentioned mounting device was applied to the dorsal hoof wall a half-inch from the ground surface. This distance was important to ensure no interfering with the normal equine gait. Hoof angle was measured before and after placement with a hoof gauge to insure similarity of hoof angle. 

file name

Accelerometer in field mount.

The accelerometer was then inserted in a premade impression material “plug” for operation, safety. Consistency was ensured by a including a “registry” pin 90 degrees to the hoof capsule embedded into the PVC container (Figure 2). Each subject horse was then lunged for 5 minutes in both directions. This was done to ensure that each horse would produce a consistent speed at both the walk and trot. Each horse was walked and trotted in hand with the use of a halter and lead rope. The horses traveled at their own pace with no pressure applied to head or neck. The routine for each shoe condition was walk and trot on the soft surface then walk and trot on the hard surface. Data was logged and checked for any recording inconsistencies after each session. 

After each session, they were reshod using the same shoe in the same nail holes for consistency of shoe placement. Data was sampled in 10-second bursts at 1,024hz and logged directly to the accelerometer. After each session data was downloaded to a computer. At the completion of each study, data was then viewed with SensorConnect2 software for quality control. Data was visually examined for each horse, and trimmed to illustrate the most consistent portion of each logging session. This data was then exported to Excel3. Raw data analysis took place using Excel and placed in a spreadsheet format with three columns of data corresponding to each channel of the accelerometer. Excel data was divided into two groups: walk and trot. 

file name

Three axis accelerometer.

Instrumentation. Wireless accelerometer G-Link 200-OEM accelerometer (Figure 3) provided by LORD MicroStrain Sensing2, adjustable up to 40G. Sample rate can be adjusted up to 4kHz on all three channels. This study used settings of 40G at 1,024Hz. A ½-size AAA battery was fitted to the device as a power supply, which allows for continuous, periodic bursts or event triggered operation. A wireless gateway, WSDA-200-USB was employed to connect to a laptop and run SensorConnect. SensorConnect was used for connecting and analyzing data in real time using data collection and graphing algorithms. This method allows instant visualization of the data collected. A laptop computer was used on-site for downloading and viewing of data. The 40G G-Link was form fitted to the custom PVC mount with dental impression material in a reusable “plug” shape.

Data Collection

Data was collected via data logger on the accelerometer and checked on site. Proprietary software options included manufacturer’s recommendation “SensorConnect” assisted in configuring nodes/accelerometer, analyze data in real time and export to Excel.

file name

A wireless node.

Collection of data started with a wireless system transferring real time through a gateway to a laptop (Figure 4). Each horse was walked and trotted 30m vduring data capture.

file name

Direction of X axis, channel 2. Each channel is 90 degrees from each other. Orientation was checked with a hoof gauge to ensure 50-52 degrees angle of PVC and accelerometer.

Data Analysis

Data was run through a custom LabView4 based software program with the specific purpose of extracting stride, stance, and breakover times. The accelerometer used in this study has three axes. In this study, data from channel #2, perpendicular to the hoof wall (Figure 5) was processed rather than a resultant of the three channels. To compare both hard and soft surfaces a signal characteristic needs to be identified-applicable to both hard and soft surfaces corresponding to the start and end of the breakover period. In our conventional definition of breakover, breakover is measured from when the heel leaves the ground till the toe comes off the ground. 

file name

One stride is measured from impact to impact using channel #2.

In soft footing, this is difficult to impossible to detect, necessitating a novel more applicable definition suitable to all surfaces. Breakover (Figure 7) was defined as the time when hoof acceleration deviated from the acceleration values measured during the “static” stance phase stance by greater than one standard deviation. The end of breakover was defined as the instant when the acceleration in the forward “X” direction (Figure 5) reached a threshold of zero, going from a negative to positive value. Stride time (Figure 6) is measured from impact to impact. Stance time (Figure 7) is measured from impact to the initiation of breakover.

file name

Breakover is measured where acceleration deviated from one standard deviation. The end of breakover is defined as the instant acceleration in the forward direction reached a threshold of zero going from a negative value to a positive.

Statistics

Raw data was exported to Excel and further evaluated with IBM, SPSS Version 26. All analyzed data with a P value<= 0.050 was considered statistically significant. A mixed model was used, with horses used as random factor and shoeing conditions (regular toe, rolled toe and rocker toe), and surfaces (hard and soft) as fixed factors.

A Bonferroni post hoc correction was used to test for pairwise significant differences between shoeing conditions. Separate models were implemented for walk and trot data with a model implemented for each of the outcome variables, stride time, stance time and breakover time. Histograms of model residuals were plotted and visually compared to normal distribution and all residuals considered normally distributed.

file name

Breakover vs. surface at walk (P=0.040). Breakover time was shortest in soft footing 0.0164ms compared to hard footing at 0.168ms.

Results

Data included shows an average of 6 to 14 strides per horse in each 10- second burst. The number of strides at trot varied from 11 to 14, while strides for the walk ranged from 6 to 8 per session. 

Breakover in the walk: Estimated marginal means of breakover time were 0.165 for the regular toe, 0.159 for the rolled toe, and 0.164 for the rocker toe. The estimated marginal means for the soft surface were 0.165 and for the hard 0.161. Breakover was significantly different between shoeing conditions (Figure 8) (P= 0.019) and significantly different between surfaces (Figure 9) (P = 0.040). Bonferroni post-hoc test showed pairwise significant differences between the regular toe and the rolled toe shoes (P=0.024). 

file name

This illustrates comparative speeds of breakover time in seconds with each shoe surface modification. The median for the regular toe 0.069s, rolled toe 0.074s and rocker toe 0.073s.

Breakover in the trot: Estimated marginal means for the regular toe (0.067s), rolled toe (0.071s), and the rocker toe (0.070s). Breakover time was significantly different between shoeing conditions (P=0.015) and between surfaces (P=0.001). The rocker toe shoe had a shorter time duration (0.063s) in the softer footing. Longer duration (0.08s) in the harder footing compared to the regular toe shoe or the rolled toe shoe (Figure 10). The most significant relationship was between regular toe and the rocker toe shoe (P=0.014). 

file name

This illustrates speed of breakover time in seconds for each surface modification relative to footing. Note the difference in rocker toe breakover speed in relationship to footing.

file name

Surface P value at walk: .001

file name

Condition P value at walk .001

Stride time at walk: Estimated marginal means for stride time were for the regular toe at 1.319s, for the rolled toe 1.317s, and for the rocker toe at 1.349s. The marginal mean for soft surface was 1.316s and for the hard was 1.341s. A comparison for surface and condition showed a significance (P=0.001) and for condition (P=0.001). Surface vs. condition showed no significance with (P=0.382). (Figures 13 and 14)

file name

Stride time vs. condition with surface (P=0.382).

file name

Stride time vs. surface with condition P=0.382.

file name

Stride time vs. condition at trot.

Stride time in the trot showed an estimated marginal means for the regular toe at 0.760s, rolled toe at 0.765s and rocker toe at 0.758s. The marginal means for the soft surface was 0.761s, and hard at 0.762s. No significant difference existed with condition (P=0.132) and surface (P=0.742) (Figures 15 and 16). No statistical significance for the Bonferroni posthoc tests (P=0.277) (Figures 17 and 18).

file name

Stride time vs. surfacea at trot.

file name

Stride time vs. surface with condition at trot.

file name

Stride time vs. condition with surface at trot.

Stance time at walk: The estimated mean marginal means for the regular toe were 0.760s. rolled toe, 0.757s, and the rocker toe at 0.782s. The estimated marginal means for the soft surface 0.757s and hard surface at 0.776s. 

file name

Median for the walk on hard surface was 0.756s and for the hard was 0.774s.

file name

Median values for the regular toe was 0.764s, rolled toe was 0.761s, and rocker toe was 0.786s.

In this instance of stance time for the walk, both condition and surface had significance with a (P=0.001) for both shoeing condition and surface (Figures 19 and 20). There was no significant interaction between surface and shoeing condition (P=0.168) (Figures 21 and 22)

file name

Stance time vs. condition with surface.

file name

Stance time vs. surface with condition.

Bonferroni posthoc test results showed significant differences between the rocker toe shoe and both regular toe (P=0.009), and rolled toe (P=0.002). 

Stance time at trot: Estimated marginal means for stance time were, regular toe at 0.330s, rolled toe at 0.347s and rocker toe at 0.337s. The estimated marginal means for the surface were at 0.343s (soft) and at 0.333s (hard). Stance trot were significant for condition (P=0.008) and for surface (P=.020) (Figures 23 and 24).

file name

Stance time vs. surface at trot.

file name

Stance time vs. condition at trot.

Stance comparison of condition and surface (P=0.309) was not significant ,with no relationship existing between shoe-surface condition and either surface for the stance phase (Figure 25 and 26).

file name

Stance time vs. condition with surface at trot.

file name

Stance time vs. surface with condition at trot.

Discussion

This study’s aim was to demonstrate that common shoe toe-surface modifications influence duration of breakover timing. The discussion of breakover in the literature regarding the rocker toe shoe (this study’s most altered modification) show they do not shorten the duration of breakover (Clayton et al., 1991). This study challenges those observations. Showing that the more extreme surface modification, such as the rocker toe, alter not only time, but duration of breakover related to footing. These trends are surprising and informative, realizing that the breakover portion of the stance phase may be altered if only by hundredths of a second. 

This study clearly pointed out the importance and influence of footing. Most notably, the altered performance of breakover by the rocker toe shoe. On the soft footing at the trot, the regular toe breakover was 0.068s, compared to the rocker toe at 0.080s, softer footing this toe modification shortens the duration of breakover. On the hard surface, the regular toe breakover time was 0.069ms. Contrast that to rocker toe at 0.080s. The hard surface breakover time for the rocker toe was notably longer.

Observations of the hard surface data alone shows a trend to extend the duration of breakover with each modification. Regular toe at 0.068s, rolled toe 0.075s, and rocker toe 0.080s, showing slightly more time spent in the breakover phase. The farrier and veterinary industries are challenged to clearly understand the impact of the ground reaction force moment arm has during breakover which represents approximately the last 5% of the stance phase (Willemen et al., 1996).

Experimental studies have shown a significant prolongation in breakover time (P<0.01) associated with an increase of toe length (Clayton et al., 1991). A longer toe increase the ground reaction moment arm requiring greater tension on deep digital flexor tendon to initiate the act of breakover. A variety of shoe types have been used in an attempt to ease breakover, the rolled and rocker toe shoe among them. Manipulation of the dorsopalmer balance of the hoof to reduce static and dynamic distal interphalangeal joint extension with rolled or rocker toe shoes is potentially critical for maintaining healthy function of the equine digit. Note the peak tension of the deep digital flexor tendon is correlated to the maximum extension that takes place at the end of the stance phase. Therefore, shoe-surface modification may reduce or avoid excess DIPJ hyperextension (Lawson et al., 2007). 

Studies in vivo demonstrate that the force distribution in the hoof moved the point of zero movement moves toward the toe in the last portion of the stride. (Barrey, 1990). This adds to the thinking and support for these shoe-surface modifications. The breakover speed time recorded in this study indicates that in a sound working horse, a regular toe or a rolled toe shoe showed no significant difference in timing for the walk or the trot. Though they all were impacted by the softer footing where breakover had a shorter time duration. The shortest duration of breakover of the three shoes in the softer footing was the rocker toe shoe. This advantage was maintained only in the softer footing. Other researchers have observed the rolled toe shoe, the horse unrolled its foot more gradually, offering a better possibility for correct coordination. This could be an advantage in the faster gaits and during other activities where loading and ultimate loading capacity are close (Van Heel et al., 2006). 

Study limitations include the number of horses investigated, data collection sessions, sample rate, number of hoofs measured and normal variations in the walk. Each additional horse increases the likelihood of managing a larger variation in hoof size, and potential body size potentially altering results. Longer data sessions would indeed be beneficial as this would improve study accuracy by increasing the number of strides, hence improved confidence in average values. This would be particularly helpful in softer footing were consistent smooth sampling is an issue. 

The addition of an opposing hoof would make for great comparison, yet other studies of one limb only presupposes that bilateral limbs behave symmetrically. There is evidence, however, that horses tend to use one limb preferentially in gait and other movements (Colborne et al., 2009). Further study investigations at the walk should be looked at as separate study. The speed of the walk varies by as much as a half of a second — a consideration all to its own. 

The reader’s attention should be drawn to the observation that the walk was difficult to maintain a consistent speed, variation of up to a half of a second potentially skewing results. Interpretation of the results must bear this in mind.

Conclusion

This study sheds light on the subject of shortening or altering stride kinematics, particularly breakover, which may be more complex than first thought. Differences in several parameters were observed — hoof-ground interaction had the most prominent impact on the duration of breakover timing, regardless of shoe-surface condition. All shoe toe-surface modifications altered breakover by shortening time duration in soft footing. The hard footing altered breakover in a way that contrasts with current literature. 

Breakover increased with each shoe-surface modification on the hard surface with the rocker toe shoe performing with the longest time duration, spending slightly more time in the breakover event. Previously documented shoe-surface geometries show no specific measurable changes. The ground reaction forces in different footing for each phase of the stride is characterized by different biomechanical loading patterns that challenge the equine distal limb showing the need for additional close study. From the evidence-based perspective, most studies evaluating the biomechanical effects of shoeing have been in vitro studies (Eliashar, n.d.).

The data gathered in this study shows that a multitude of conditions need to be considered to achieve maximum results from shoes with surface modifications. The kinematic differences between shoe modifications here are small. These are difficult to detect with instruments, let alone the unaided eye. Additional research is needed to complete this study, providing clearer understanding of the topic of breakover, along with positive changes in industry practices and policies. 

Acknowledgments

The author would like to acknowledge the following: LORD Micro Strain for their equipment and assistance with software, and hardware application. Dr. Thilo Pfau for guidance throughout this study. The fellow graduate students for their support and assistance, which made this project possible. Dr. Tim Worden for his assistance. This study was funded and supported by the United States Eventing Association Foundation, Caro Dayton and Debra Dayton.


References on Page 2